Reflections on December’s NCUA Board meeting

No exact count is available, but close to 1,000 pages of staff material including BAM’s, budgets, proposed rules and other supporting material were provided NCUA  board members for December’s meeting.  The material was for decisions having, I thought, great moment for credit unions’ future.

Discerning what matters in such an output in the 5-10 working days when staff’s final versions are delivered is an impossible task.  Decisions are made and priorities set, not by rational debate or objective facts, but fatigue overload.

The so-called “bipartisan” vote is cast because there is no way to develop alternatives. Process overwhelms the participants unless you’re the one in charge of the process.

Here are two reactions about the meeting’s outcomes:

From a longtime colleague:

The slow but steady March to oblivion continues.

There were 18,000 credit unions when I started. Are we under 5,000? And over 1/3 of them are under 50 million.  It used to be 80% of the assets in 20% of the credit unions. Is it 90/10 by now?

You’re 77, I’m 70. The question is “will credit unions outlive us, or will we outlive credit unions?” I’m going to eat well and go to the gym to increase my chances.

By Elon Musk:

Rules and regulations are immortal. They don’t die. And if more rules and regulations are applied every year and it just keeps growing and growing, it just takes longer and longer and it’s harder to do things. (from WSJ interview).

If I heard correctly during the meeting, one part of the new RBC rule dealing with goodwill has a 2029 expiration date. In this case immortality is only ten years.

If Only in My Dreams

My first reaction to the meeting was deep disappointment for both credit union leaders, their members and NCUA directors.  Decisions were disconnected from reality and relevant data.  Political agendas set half a decade ago were now being imposed by fiat, not need.

During this time of year in 1943 during WW II, one of the most popular songs was Bing Crosby’s  I’ll be Home for Christmas. It begins:

I’ll be home for Christmas
You can plan on me
Please have snow and mistletoe
And presents by the tree 

The final stanza:

Christmas eve will find me
Where the love light gleams
I’ll be home for Christmas

If only in my dreams

The melody is memorable; however, the meaning is quite somber. The reality longed for will be just a dream.  Until the bigger events involved are over and life can once again be lived on terms we are free to choose.

In our life’s most earnest commitments, usually work or family, we continue to long for the best. That “feeling of being at home” gives us satisfaction and meaning. We use our creativity to achieve this sense of purpose, where we truly feel comfort.

I slowly realized my and others’ disappointment with the Board’s actions were from my thinking NCUA was “home” for credit unions.

A Mortuary Is Not a Home

The “home” credit unions pursue is their side-by-side journey with the members. It is not a set of rules promulgated by a government agency.  NCUA is no home for credit unions.  Its primary role today is as the mortuary for credit unions.

Looking to NCUA to understand the aspirations of credit unions, their members’ longings and the power of cooperative design is “only in your dreams.”

Hope is intrinsic for life to have meaning.  That is what credit unions at their very best try to deliver in every member relationship.

My error was believing that NCUA leaders might also share that same goal. The meeting was a slap of cold water in my face, an important reality reminder.

For that I am grateful.  It is credit unions that bring members the “wonderful life” this time of year, and all year round.  As the angel Clarence says to George Bailey: “Each man’s life touches so many other lives, and when he isn’t around he leaves an awful hole, doesn’t he?”

NCUA’s primary capacity is creating  holes.

Credit union’s strength is because members believe this is their own financial home which they can trust.

That financial reality is not based on new rules, budgets or even a guardian angel fund.   Instead, it is created from loyalty and relationships built over decades, or what, at this time of year, we call Goodwill.

A Nativity Play-Poem

Amid sheepish shepherds,
embarrassed kings, awkward angels
with their bent-coat-hanger wings –
my most unforgettable character
is the tender-hearted lad
assigned to play the innkeeper,
who undid the whole production
when he assured the wandering couple,
“You folks are so, so lucky.
We just had a cancellation.”

by J. Barrie Sheperd

Today’s NCUA Board Decisions: Encouraging Credit Unions to Help Members Succeed or Adding More for the Regulator

There are two weeks left in the year.  But we already know that in the second year of pandemic pivots and uncertainties that credit unions have again and again responded to urgent  member needs.

Daily reports of year-end bonus payments and record levels of loan re-financings are adding  millions of dollars to member’s wallets.

While yearend NCUSIF numbers are not yet complete, it appears this will be a second year in a row of net recoveries and no insured losses.

But America is not out of the woods.  Covid continues to play havoc with well laid plans.  Interest rates will go up.   Both costs and prices are in a rising phase-no one knows for how long.

2022 looks to be another year of “transitions.”   To the office or not.  More virtual or hybrid meetings.  Continued efforts to find the right employees.  How can we save costs.

The Environment for Today’s Meetings

The notices below in the DC’s Union train station and a vending machine in a hotel capture what the ordinary person is dealing with in this uncertain economy.

These are glimpses of the  external context for  NCUA’s decisions that will set agency’s spending pattern and priorities for next year.

Will the board’s decisions inspire credit unions to do even more for their members especially those who are vulnerable still?

Will the last two years of virtually no NCUSIF losses encourage the board to adopt the historically proven 1.3% cap and reaffirm the NCUSIF’s long proven cooperative design?

Will the enormous burden and cost in member value of a CCULR/RBC implementation be paused or even tabled, while more data can be gathered about the benefits it is supposed to bring?

The NCUA board is facing hard decisions.  Will they recognize the unique challenges for credit unions to do more for members?  Or more for NCUA?


“No Wonder We All Are Bored with NCUA Board Meetings”

This week I asked my good friend Randy Karnes for his perspective  on the upcoming NCUA board meeting (12/16/21). Here’s what he had to say:

Chip hoped that I might inspire the NCUA board to consider its agenda differently; to move away from the agenda’s details and towards activities that would craft a new expectation for us all.   

NCUA and its governance needs to focus on bigger issues. Issues that inspired owners. Issues that made business fun for those who derive  meaning from their efforts. Issues that extended value so that the everyday owners, and professionals reporting to them, would care about board meetings and NCUA’s  oversight functions.

He hoped the three politically selected directors would consider that we need more from the regulator.  We want a group that cares about our professions, our ideas for governance,  and our safety nets.  That the credit union-funded institutions at NCUA are still there to back our plays, our efforts, and our belief in the work ahead.

So I read Chip’s 12/13 blog as the inspiration for my comments, but only found the inspiration to declare I understand why no one gives a sh*t anymore.

Here’s what we’re looking at for Thursday; an agenda that claims we should be paying attention:  Got to wonder?

Multiple issues with the RBC/CCULR capital regulation, a topic of great concern that will affect the CU industry for years to come – a bureaucratic press headline and a staff that cries wolf.

    1. Lots of numbers (NCUA/FDIC) – far from any consequence for those locally looking for numbers that will sustain them.
    2. CU’s have already maintained enough dollars for last few “so called crises” – but who would waste a crisis yet to come?
    3. Is it credit unions  or the NCUA Board  who is focused on “change for change” to their own ends – we see no need for any capital change.
    4. Why trust their “ends” at all, no wonder we all are bored with NCUA board meetings, they are not for us and we hear no mention of us in their words or declarations.
    5. More reg burden for the sake of burden. Another option for NCUA to leverage their situational control of our members’ futures. These new tools are ineffective and simply clutter other work that screams for action.
    6. Confusing stats for the sake of stats, oil and water displays, confusion just to take our eyes off the ball – member value.
    7. Member faith in NCUA thinking is muddled by over wrought academic complexity.  No workman’s simplicity in this group, that would take experience; a care for the work.

Now shift to the budget item.

The next budget is just another edition off  an assembly line of budgets – cranking out ugly babies with no mirrors in sight. More spending wanted, when less would send a message of hope and clarity.

    1. Planners who expect a rising  curve of more money in this to the next year, to every year – void of awareness from past exploits or value adds.
    2. More people to pad our importance, to enhance processes now un-manned, and with no plans for when needed. We need more people without recognizing there are none to be had.
    3. The budget is not about the flow of our industry and the requirements for its sustainability.  It is simply to ensure the NCUA outlasts its ward, that the NCUA is the last group standing.
    4. The industry’s funds are always there to direct, and NCUA will always be  quicker, slicker, and quietly positioned to direct those funds from members’ activities to a bureaucratic engine fueled by money.
    5. Just give us more, we are hungry.

These are the “minutes” for the 12/16 NCUA Board meeting,  ahead of time, a template of expectations from a bored audience of the industry’s CU members – customer-owners who wonder why the value of ownership has lost its punch.

But the funny thing is we all really do still give a sh*t! We are hungry to believe, follow, and to give homage to the NCUA’s efforts if they would simply find the heart to sell us that they still have the will to deliver value to our members. The heart to simply believe in the work of cooperatives. The heart to inspire us with the simplicity of a local community’s effort to lift itself up by work well done.

I know that Chip wants me to declare that 12/16 is a day for us to rally our voices and take on these tactics from the agenda – to shout we give a damn about RBC/CCULR or the board’s broken budget processes, but I can’t.

The only goal I have for the NCUA’s board and bureaucrats is to work harder, and work smarter to bring back those days when we waited in earnest to read the press reports of an NCUA board meeting. To read the reports ready to smile with the effort and the intent that made us believe we had a valuable ally for our futures.

It’s not that America has given up on its institutions that ensure our success; rather we simply forgot how to promote  leaders for these institutions whose roles are to guard and foster our efforts. We need to change how NCUA board members rise to the occasions ahead.

Too many times these directors have started out as lame ducks….and it has nothing to do with their terms. Lame work is becoming the standard.

Tell Me Why I’m Wrong.


Tomorrow’s NCUA Board Challenge:  A Turning Point of Just More of the Same?

Most individuals and organizations  realize at some point in their journeys,  that money does not guarantee success.  Nor happiness.

Thursday’s NCUA Board is, at first glance, all about money.  Tens of millions.  And how it is to be raised, allocated and spent.

Since all NCUA’s funds are from credit union members, it behooves we all pay attention. For NCUA has no other revenue. It is the steward of almost $400 million in annual costs paid by members.

The Board’s financial decisions on Thursday  include:

  • The size of NCUA’s annual and capital budget spending;
  • How these costs are allocated (OTR) between the CLF, NCUSIF and Operating Fee;
  • The limit, or cap, on the maximum relative size of the NCUSIF via the NOL, after which a dividend must be paid;
  • The disposition of the approximately $100 million in surplus retained in the Operating Fund from excess FCU annual fees collected over recent years.
  • Even the proposed CCULR/RBC rule is about money, not just burden. It would require credit unions to retain from revenue initially as much as $26 billion more in reserves that would otherwise be available for greater  member value and service.

All About Money, or Is It?

The justifications for the amounts NCUA is seeking, is that the regulator’s financial resources are what sustains a safe and sound movement.  More financial resources enables more effective supervision.

This leadership approach is a fallacy.  It is often used to explain NCUA’s and even many  credit union decisions.  Institutional strength or capability is measured by asset size, by net worth ratio or for NCUA, the annual spend or dollars on hand.

Resilience Not Resources

However, over and over again especially this year, events have shown that resilience is a leadership characteristic, not the amount of resource an organization controls.   Credit unions with double digit net worth, managing hundreds of millions, even billions, are routinely merging saying they lack the resources to cope with future challenges.  That is a leadership failing, not a resource gap.

Every credit union in existence today was started with no financial capital.  They survived, prospered, and thrived because of volunteer sweat equity, sponsor support, member self-help and shared belief in their purpose.  In other words, leadership.

These critical intrinsic motivations are being replaced with an assumption that more and more dollars are the key to survival.   The thought that resilience depends on more dollars cuts against the grain of what a coop financial system is and can be.

This reasoning is used by some CEO’s who end their tenure with mergers accompanied with large added retirement or financial bonuses.  Greed not gratitude becomes the hallmark career-end.

Who Will Credit Unions Become?

How the Board decides the issues before it tomorrow will send a clear message who they believe credit unions are today and what they will become in the future.  Will it be about more money for NCUA or an effort to inspire credit unions through careful stewardship of their resources and decisions based on objective data?

During the past two years of the pandemic credit unions have shown their best side.  Waving fees, making loan adjustments, lowering charges, and being with members or in person no matter the severity of the epidemic.   The growth in member savings and bottom lines have resulted in back-to-back record setting outcomes and zero NCUSIF insurance losses.

Daily credit unions are announcing bonus dividends to members to share their success in the millions.

The board’s decisions on resources will communicate their view of whether credit unions are special kind of financial service provider that warrants further inspiration, or just a minor-league version of banking.

Will the board present made up worries and projects lacking outcomes to support funding?  Will it succumb to temptation to offer unknowable future risks to retain unneeded reserves?  Will it affirm the idea that every credit union must stand on its own bottom—no system safety nets or mutual support in the event of problems?

All for One and One for All?

Credit union’s manage people’s money to promote other member’s financial opportunity. The well-being of one is linked to the well-being of all.   The same approach has, in the past, applied to credit union’s intra-dependent cooperative system design.

The result is credit unions are much stronger than individual numbers alone would ever indicate.  The member relationships, based on a premise that this financial community will help ones neighbors, creates goodwill and loyalty creating value that far exceeds  financial ratios.

Credit unions are a classic example of American innovation with leaders that have attracted  tens of millions of adherents or fans, called members.  It is self-help, self-financed and self- governed, formed from the grass roots and built on community respect.

A Contradictory Stance On Credit Union’s Role

The NCUA board has represented a different portrait of the system.  In the past decade, NCUA’s priorities suggest credit union’s meaning and value is measured primarily by how many dollars are on the  balance sheet and in net worth.

The whole theme is to get more.  There is no underlying recognition about the practical life of the members or their credit union’s role.  Such a world view cannot inspire the movement let alone feed the soul of  members.

NCUA’s increasingly dystopian views augmented by faulty analysis and misleading numbers blinds them to see what they can’t see.  NCUA no longer see credit unions as they are, because NCUA see things as they are.  They no longer seek information that would change their approach;  rather they look for a story that confirms what they already have in mind.

NCUA’s decisions rest on a simple falsehood that more is necessary rather than a more  complex reality.  Resilience and credit union success is not built on financial performance, but by leaders imbued with purpose and community well-being.

Inverting Common Sense

Even worse is the proposed RBC/CCULR rule.  It inverts the legal maxim that bad cases make bad law. In NCUA’s  view a bad loss requires an ever more complex rule.

When NCUA approves a generally applicable rule like RBC to counter an extreme outcome or circumstance, the risk is that all credit unions’ freedoms are now restricted by the behavior of a very few.

The burden of the RBC/CCULR rule will fall directly on the membership, in the initial proposal by at least $26 billion.

Will the NCUA board respond to the incredible credit union performance during the pandemic for members.  Will it say, “Job well done?”  Or now is our time to get more funds?  Will they respect and recognize the documented track record of the industry since 2008 (reported yesterday) or will they continue to present misleading analysis and mythical future outlooks?

Whatever the outcome, it will set the tone and direction for years to come.  It is unlikely there will be a better time or circumstance for the NCUA board to affirm its faith in the credit union system, the performance of cu leadership during COVID,  and to restrain the never ending instinct  to acquire more resources.


Why the RBC/CCULR Should Be Dropped

The following observations ares from an expert who has worked financial institutions for years.   This academic-style analysis uses  NCUA and FDIC data.

The author sent this summary comment along with the charts:

Any increase in net worth regulatory requirement is a tax on asset growth. Credit unions must grow to maintain market relevance (i.e., they need income to invest in technology, security, regulation, product development, etc.). Adding to the burden just makes it more difficult for credit unions to fulfill their mission. This is a statement of fact.

The corporate credit union collapse was really a double-whammy to credit unions. Not only did they need to replace reserves due to loan losses, but they had to shoulder the burden of NCUSIF and TCCUSF expense/assessments. Had the system been only holding 7% net worth in the aggregate, it would have been able to overcome economic fallout from the Great Recession without falling below 6%. (see the stress test observation #3)

In any system outliers exist. There will always be a few that engage in activities that put themselves at risk (fraud, credit risk, concentration risk, interest rate risk, etc.). The role of the examiner is to identify those activities and enforce policy to make sure they don’t happen.

Asking everyone to hold more capital, because of a handful of outliers, does not fix the root problem; rather, it allows it to propagate knowing a safety net is in place. At the end of the day, it would be a lot cheaper (and more effective) to increase  examinations instead of asking credit unions to hold more reserves.

Observation #1: Sound underwriting protected credit unions during the Great Recession years.

The biggest threat to credit union reserves is loan losses because of the speed and magnitude in which they can occur.

The bars on the chart are net charge-offs as a percent of assets (to facilitate comparison with reserves which are also measured as a percent of assets).

In the five years prior to 2008 and the nine years following 2012, loan losses averaged 0.33% of assets with a small standard deviation, a sign of consistent and sound underwriting.

During a five-year stretch from 2008 through 2012, credit unions reserves were hit the hardest, due to economic fallout from the Great Recession. Loan losses averaged 0.62% of assets (almost double the normal rate). However, credit union losses were 37% lower than FDIC insured banks which averaged 0.99% of assets.

Observation #2: Credit unions added to reserves during the Great Recession years and the economic fallout resulting from COVID 19.

The line on the chart is income before net charge-offs as a percent of average assets. It represents the surplus available to offset loan losses and add to overall reserves (loan loss reserve or net worth). The bars on the chart are net charge-offs, also as a percent of average assets.

The difference between the line on the chart and the bars is the amount added to reserves. This chart includes NCUSIF and TCCUSF expense, to demonstrate the impact of the corporate credit union failure on the system.

Despite elevated loan losses and NCUSIF/TCCUSF expense, credit unions added to reserves every year, including the Great Recession years and during the COVID 19 aftermath.

Observation #3: A stress test shows that at 7% net worth, adequate reserves were present to weather the Great Recession and subsequent corporate credit union collapse.

The line on the chart is income before net charge-offs as a percent of average assets. It represents the surplus available to offset loan losses and add to overall reserves (loan loss reserve or net worth). The bars on the chart are net charge-offs, also as a percent of average assets.

The dots with data labels are the result of a stress test that set net worth at exactly 7% of assets prior to the onset of the Great Recession and subsequent corporate credit union collapse.

Under this real-world stress test, credit union reserves would have dipped below 7% well capitalized but would have exceeded 6% adequately capitalized, even after absorbing just over $8.4 billion in TCCUSF and NCUSIF expense from 2009 through 2013 – the equivalent of 0.89% of credit union assets.

Furthermore, credit unions would have built up ample reserves to absorb the shock to net worth in 2020 and 2021 due to stimulus activity that inflated the liability side of the balance sheet (not the riskier asset side via loans).

Observation #4: Credit unions have consistently maintained excess reserves beyond 7% well capitalized.

The line on the chart is net worth as a percent of assets. The dashed line is net worth plus loan loss reserve as a percent of assets (i.e., total reserves).

Credit unions have consistently maintained excess reserves beyond 7% well capitalized – and those reserves have been sufficient to offset loan losses resulting from the Great Recession, the subsequent corporate credit union collapse and the rush of stimulus dollars injected into the economy in 2020 and 2021.

Observation #5: An impact assessment shows that increasing the capital requirement would affect up to 651 credit unions greater than $400 million in assets requiring an additional $26.5 billion in net worth.

Proposed regulation would impact credit unions exceeding $500 million in assets. Credit unions approaching that threshold would also be impacted as they must prepare for crossing it. The impact assessment looks at the 808 credit unions who currently have more than $400 million in assets as of 2021 Q3.

The bars on the chart to the left represent a distribution of credit unions by net worth strata. There are currently 349 credit unions with net worth below 9.5%. The line on the chart represents the cumulative number of credit unions across the strata. There are 651 credit unions with less than 11.5% net worth.

Credit unions will always hold a buffer above the regulatory net worth requirement. System-wide, credit unions currently have a 3.2% net worth buffer (10.2% 2021 Q3 net worth minus 7.0% well capitalized equals 3.2% buffer). To evaluate the impact of an increase in regulatory net worth, an assumption that credit unions will hold a buffer of 1.5% is used. So, if the definition of well capitalized increases to 10.0%, then a credit union would hold 11.5%, a buffer of 1.5%.

The chart on the right shows the amount of additional net worth dollars required to reach a target net worth ratio. If the regulatory requirement increased to 10% then credit unions would hold 11.5%, requiring an additional $26.5 billion of net worth.

Regulatory net worth is a tax on asset growth. This is a statement of fact. It requires resources be directed to reserves held idle on the balance sheet, instead of being used for investment in credit union products and services, technology, security, wages to provide employees with a fair standard of living, DEI (diversity, equity, and inclusion) and community impact initiatives. Increasing the regulatory requirement erodes competitive position and makes it harder for credit unions to fulfill their chartered mission.

A Pivotal Week for the Credit Union System’s Future

On Thursday, December 16, the NCUA board will meet to decide a slate of issues that will affect the credit union system for years to come, not just 2022.

The most consequential item is the proposal to approve and implement an entirely new RBC/CCULR capital regulation.

Tomorrow I will share one expert’s  analysis of the capital adequacy of credit unions since 2008.   All the numbers use NCUA and FDIC information.

The data, stress tests and bank comparisons demonstrate that credit unions created and maintained more than sufficient capital during the two most recent crisis, and the unprecedented growth in shares in 2020-2021.

The numbers are tested against actual data.  They clearly document credit union’s superior loan loss record versus banks.

The analysis poses the core issue: How does changing a tried, tested and proven system of capital sufficiency improve safety and soundness?   The rule provides no evidence that it would have in the past, or will in the future.

In fact the outcome is likely to be just the opposite.

If RBC/CCULR rule is implemented in any form, it will place a regulatory burden on credit unions that will be greater than any other rule ever passed.  Every credit union over $400 million (approaching the $500 million complex threshold) and above will have to maintain two different capital calculations under CCULR/RBC.  This occurs no matter which new standard a credit union  might wish to follow. For it will have to constantly monitor which is most advantageous for its circumstances.

Cross industry comparisons will become at best confused and at worst completely useless.   How do you compare a CCULR reporting credit union with one who has adopted the RBC approach with 8% net worth but a 19.5% RBC compliant ratio.

This new burden will fall directly on the members.   Members across the board will lose value for a rule that has no objective validation.

Budgets: Approving Spending Years into the Future

NCUA’s budget has a procedural flaw.  Estimates for the next year’s budgets are based on prior year’s budgets, not expenditures  or what was actually needed.  Therefore assumptions are carried forward, regardless of whether the circumstances justifying prior year’s requests  still exist.

For example one of the budget explanations  is a charge to the CLF as follows:

“total NCUA staffing includes five FTEs funded by the Central Liquidity Facility in 2022”

The CLF has not made a loan in over ten years.   Why should there be a need for any full time staff for an organization  that only manages a billion or more of credit union shares but has never developed a single program or made a loan to assist the credit union system for more than a decade?

Once a position is approved, it never goes away.

NCUA’s budget process is designed to justify spending rather than evaluate whether more resources are actually necessary to do the jobs at hand.

The major budget decisions include:

  • Increasing millions in additional spending charged to three funds plus capital spending;
  • Adding up to 48 new positions in addition to the seven approved at midyear;
  • Approving an allocation of NCUA overhead to the NCUSIF. Will it be based on the percentage of insured savings in state charters or some arbitrary number adjusted year to year without objective validation?
  • Setting the normal operating level (NOL) for the NCUSIF.

The question for the board is whether to direct staff to better manage the resources on hand or continue growing budgets unrelated to actual outcomes and efforts.

Each of these decisions will have significant impact in future years.   Will the NCUA board stop practices that are disconnected from actual facts and analysis, or will it just kick the can down the road?

Read the draft of the NCUA 2022-2023 budget here.

A Better Way-NCUSIF Losses and Revenue Management

(Part 3 of 3 on the NCUSIF , A Better Way for credit union share insurance)

In 2010 GAO reviewed the FDIC’s financial statements for 2008 and 2009 (report 10-705). The summary, What GAO Found, contained the following comments:

“Because of a material weakness in internal control related to its process for estimating losses on loss-sharing agreements, in GAO’s opinion, FDIC did not have effective internal control over financial reporting  . . As of December 31 2009 the DIF had a negative fund balance of $20.9 billion and it had a negative 0.39 percent ratio of reserves to insured deposits.”

This was the third negative position for the fund since deregulation. In the most apocalyptic and highly erroneous NCUA projections about the corporate crisis during (and after) the Great Recession, none projected the NCUSIF would ever be in a deficit position.

After these two significant  economic downturns in one decade, the NCUSIF stands tall, stable and resilient.  However current NCUA Chairman Harper has openly called for the NCUSIF to be changed so it can mirror the FDIC-an entirely different financial design.

His suggestions show a  lack of knowledge about how the NCUSIF has succeeded in an environment that has seen every  other federal deposit insurance premium-based system fail.

NCUSIF’s Record in Recent Crisis

The 13-year period from 2008 through 2020 includes two serious economic downturns.

The cumulative insured loss rate for credit unions during this period is 1.5 basis points(bps) as shown below.  The annual losses range from 0 in 2020 to 6.96 bps when the taxi medallion losses were recorded in 2017.

The NCUSIF’s financial design rests upon the 1% deposit underwriting which grows proportionately with the insured risk plus an equity cushion that has had a traditional cap of .30 basis points of  insured shares.

The board is required to manage this equity level between .2 and .3.  If the NOL is under 1.2%, then the board must present a plan to return to this range.  Above the 1.3% cap (or other limit set by the board to a maximum of 1.5%), the board must pay a dividend to credit unions to reduce the equity to 1.3%.

Loss Provision Estimates Way off Mark

The fund has never incurred losses close to this 10 basis point range.   However NCUA’s loss estimates have often been spectacularly in error.   This graph shows that net cash losses reported in audits have no relation to provision expense.

The next chart shows how the much the overfunding of reserves  compares to actual losses.

The yearend loss reserve has fluctuated wildly  exceeding subsequent actual cash losses by over 10 times in multiple years (1,000%).

These wide disparities between actual losses and provision estimates require subsequent reserve adjustments.  These create very misleading financial bottom line results.  The provision expense, subtracted from or added back to earnings does not present  actual loss experience in a timely and consistent manner.

The fund’s structure is more than adequate for insured credit union losses.   What is most ominous is that NCUA seems to have no consistent, objective and verifiable method for setting the loss reserve.  That is a management problem, not a fund design issue.

When the  annual operating expenses of 1.8 basis points are added to the 1.5 basis points, total costs average 3.3 basis points.  As outlined earlier, the most persistent increasing expense is NCUA’s overhead transfer, not the costs from insured loses. This expense should be more controllable but has in fact become an increasing funding source covering almost two thirds of NCUA’s annual budget.

What About Revenue?

Costs are covered by revenue.  In addition to the two costs above,  income is required to maintain the retained earnings portion of the NOL growing at the same pace as share growth to keep a ratio in the .20-.30 equity range.

The math is easy.   An example. Assuming $1.5 trillion of insured shares, a cash loss rate of 1.5 basis points requires $225 million of income.   As investments equal 1.3% of insured savings, the an investments yield 1.2% covers losses.  To pay the 1.8 bps overhead expense adds another 1.4% for a 2.6% yield to cover all costs in the most 13 years.

If  the long term growth rate is 6.5% of insured savings, an additional yield of 1.3% is necessary to maintain equity. Using just the last decades results would seem to require a 3.9% yield to sustain the funds NOL.

But this return on investments is not required in most normal years.  And a far lower yield, as in the 2021 of 1.23%, can still result in a very strong bottom line.  Here’s why.

First, average insured losses at 1.5 bps are much higher than the long-term historical outcome.  The 13-year experience reflects two unusual events: the Great Recession of 2008-2009 and the taxi medallion losses.   If those three years removed from the average, the average insured losses are far below 1 basis point.

In 2021, insured share losses have been zero and there have been net recoveries from previous loss expense provisions.  In 2020, there were nil insured losses. In the previous three decades prior to 2009, insured losses were often zero and far under the most recent period’s 1.5 bps.

Overhead expense can be controlled.  It has grown at the same rate as insured shares (6.5%) because NCUA has transferred a disproportionate amount of its budget increase in every year to the NCUSIF—over 62%.  If the NCUSIF expenses grew at the same percentage as NCUA’s overall budget, this would reduce the 1.8 basis point portion significantly.  Moreover the growth in the investment portfolio shows that in 2021, the yield needed to cover this year’s projected $195 million OTR is only 1 bps.

Finally the equity ratio is a range of 1.2-1.3.   It can and has historically varied between a low of 1.24 to the cap set by the board in the past 13 years.  In other words a 1 to 2 basis point variance in yearend NOL is normal.  And if there is a truly unforeseen event, then the premium option can be exercised.

But the average model does provide guidance to the fund’s most important month to month role of managing the investment portfolio.   As described in prior posts, the NCUSIF investment committee seems oblivious to the current period of historically low interest rates.

As recently as August during the increased market worry about inflation and rising rates, the  investment committee acted by rote. It laddered out $1.2 billion (6.2% of the fund) at an average weighted  life and yield of 5.7 years and .943% .  One seven-year investment decision alone cost credit unions $42 million in lost revenue because of the committee’s timing.

This is not the first time the committee has made similar decisions seemingly oblivious of the historically low interest rate period the economy is passing through.

These kinds of investment decisions, the continual piling on of expenses, and significantly erroneous estimates of loss are all examples of inadequate management.  No fund design can overcome human folly.

A Dynamic Model to Follow performance

Even with a 1.22% yield in 2021, the financial reports through September suggest the fund will in fact have positive net income and grow the equity ratio.  Why?  There is minimal loss reserve expense and net recoveries from prior loss reserves, a lower cost  of operations, and a decline in insured share growth from 2020.

A simple spread sheet model can track all these variables in real time.  The spread sheet accessed here uses the September numbers for the NCUSIF and insured share growth.  It projects a year end equity ratio of 28.19 which with the yearend 1% deposit true up equals an NOL of 1.2819%.

So even in an historically low yielding and poorly managed investment portfolio, the fund’s result is within the designed outcome.

Even Better News

Traditionally the fund’s equity has not included the loss reserve which has been expensed from earnings but not used.   When this reserve is added to the yearend actual equity ratio, then the NCUSIF reserves are even stronger, always exceeding .30, sometimes by as much as 10-20 basis points higher.

The Better Way design works, not because it is perfect, but because it is flexible and aligns resources with insured risk through constant 1% deposit required from credit unions.  It tales prudent management of expenses, careful loss control and conscientious investment management.

To continue NCUSIF’s performance pattern, four steps should be taken:

  1. Audit and present the fund’s financial position following private GAAP accounting standards. Reset the NOL cap to 1.3% and follow accounting practice used prior to the 2001 change in recognizing the 1% deposit true up.
  2. Reduce the OTR to 50% to correspond to the percentage of state-insured shares in the fund.
  3. Update the oversight and transparency of the NCUSIF investments.
  4. Continue to minimize losses to the fund by working through problem cases not cashing out losses problems by sales to outside bidders.


A Better Way IF Expenses Are Properly Managed

(Part 2 of 3 on  the  NCUSIF, A Better Way for credit union share insurance)

Throughout the NCUSIF redesign effort in 1984, credit unions had one primary concern with the new concept.  The question was, “If we send this money to Washington, how do we know government just won’t spend it?”

In response the legislation and implementation included multiple guardrails to prevent misuse of the fund by NCUA.  This included a legal cap of 1.3% on total fund size, after which a dividend must be paid; a limit on assessing premiums;  an annual independent  CPA audit following GAAP accounting; monthly public financial reports to the Board; the ability to withdraw the 1% deposit and a commitment to use the fund to minimize losses through 208 and other forms of temporary capital assistance.

Credit union concerns were well-founded.  The NCUA has become increasingly agile in charging the NCUSIF for its operating overhead expenses.

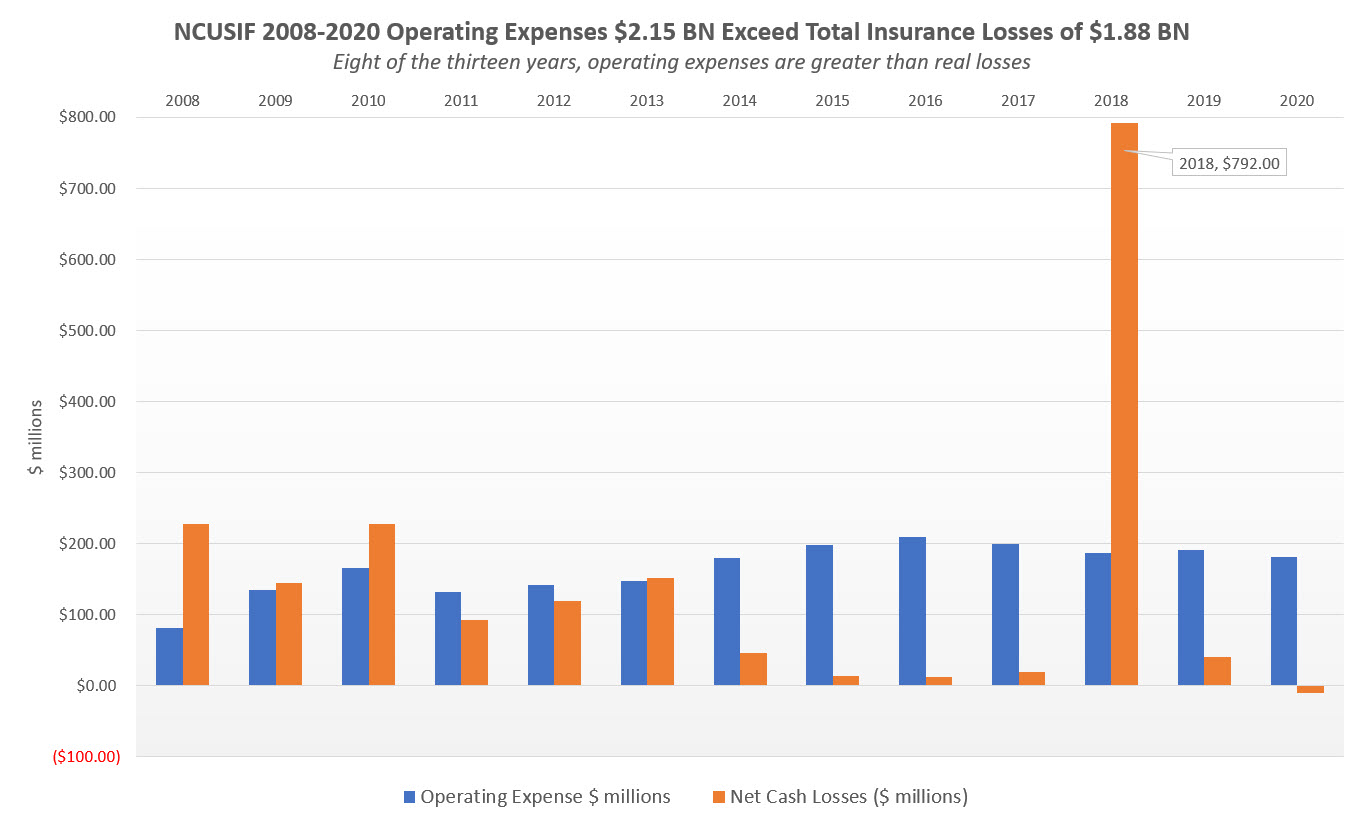
In the 13-year period 2008 through 2020, NCUA has spent a total of $3.321 bn.   Of that amount the operating fee has covered $1.172 or just 35% of NCUA’s expenditures. The NCUSIF has been charged $2.149 bn, or 65%.

Prior to the OTR change in 2001, the fund had never paid more than 50% of NCUA’s operations.

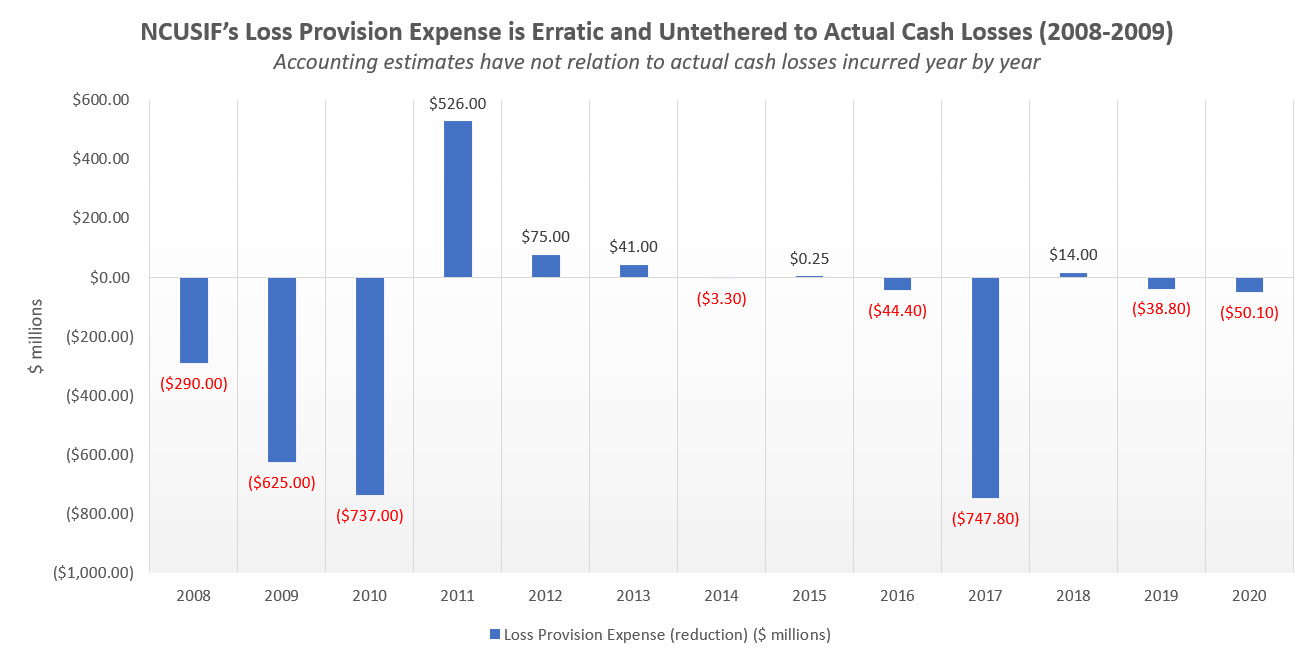
The Fund’s primary expense is for administration not insured losses

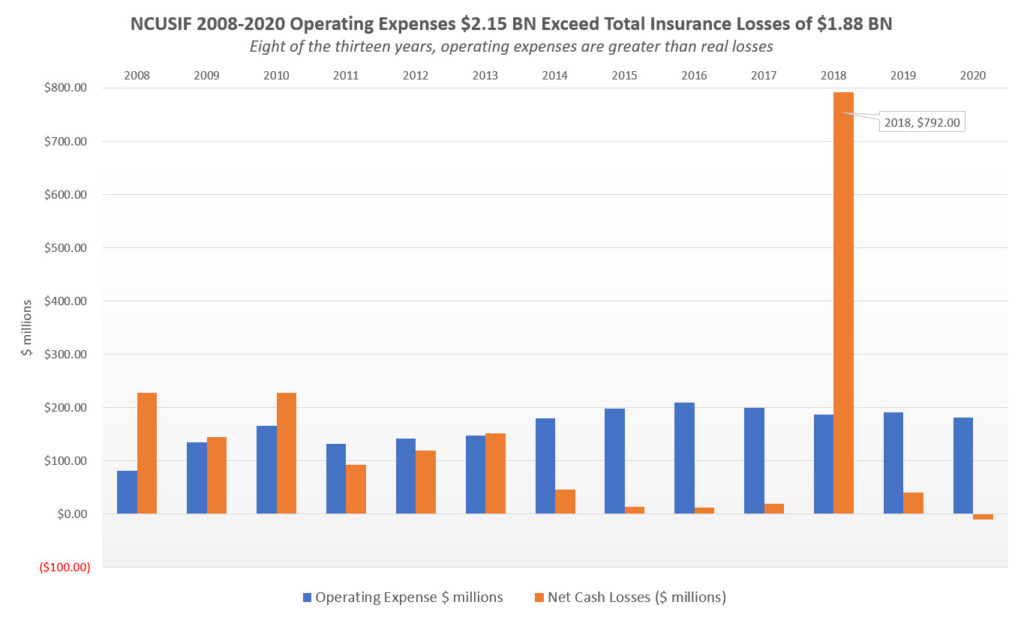
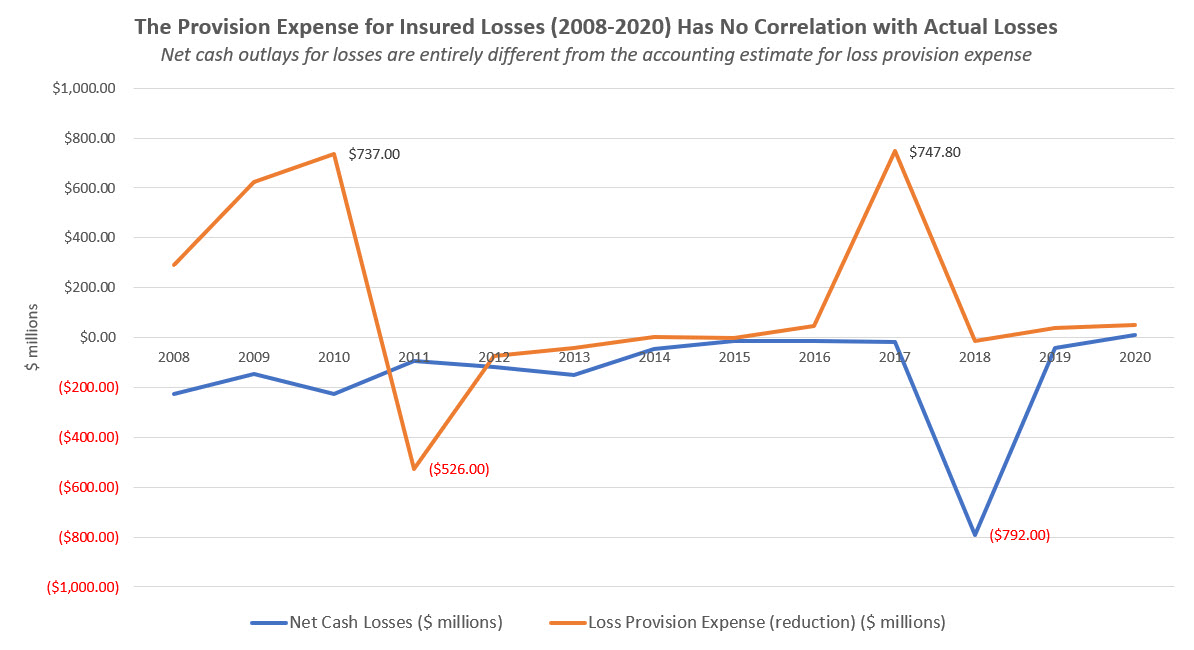
As a result, since 2008 NCUSIF’s operating costs exceeded the insurance loss provision expense of $1.880 billion by $270 million.  The primary financial role of the fund is to pay for insurance losses.  The cost have  been primarily through the Overhead Transfer Rate (OTR) process.  This process has been a source of ongoing  manipulation starting  in 2001.

The OTR History

Prior to 1985, the OTR was 33% which was based on the percentage of state-chartered insured shares in the NCUSIF.  In 1985 shortly after Ed Callahan left NCUA, the board raised the OTR to 50% even though the percentage of state chartered insured shares was still 33%.

This 50% ratio remained constant until 2001.  Dennis Dollar, as an NCUA board member and Chair (1997-2004),   made two changes in how the NCUA managed the NCUSIF. The first was making the OTR an annual adjustment, versus a fixed 50%  and secondly, delaying the recognition of the 1% deposit when calculating the yearend NOL.

The first change as reported in footnote 8 of the 2000 NCUSIF audit under the heading, Transactions with NCUA Operating Fund:

The allocation factor was 50% to the Fund and 50% to the NCUA Operating Fund for 2000 and 1999.  On November 16, 2000 the NCUA board voted to increase the allocation factor to the Fund for 2001 from 50% to 66.72%.

The only explanation for the change was that a new study of staff time spent on insurance versus supervision “indicated the rate should be changed to 66.72% for 2001.” ( Page 31 NCUA 2000 Annual Report)   This 33% increase in the transfer was at a time when state chartered  insured shares were only 44.6% of total NCUSIF insured risk.

Since this 2001 break with the long standing 50% transfer, the OTR has been recalculated every year reaching a peak of 73.1% in 2015.  The transfer rate for 2021 is 62.3 %.

The OTR has been the topic of contentious congressional hearings plus countless credit union objections to the arbitrary nature of the process.  See this link for congress’ questioning the OTR.  Even board members have expressed puzzlement with the explanations for how the transfer rate is determined.

Changing the NOL Calculation

The second change made in 2001 also had an ongoing consequence to the fund’s financial position and credit union’s dividend payment.

In 2000 the Normal Operating Level (NOL) was calculated as follows in footnote 5, Fund Capitalization:

The NCUA Board had determined the normal operating level to 1.33% as of December 31,2000, which considers an estimated $31.9 million in deposit adjustments to be billed to insured credit unions in 2001 based upon total insured shares s of December 31,2000. . . The CUMAA mandates the use of year-end reports of insured shares in the calculation of specified ratios and thus dividends related to 2000 will be declared and paid in 2001 based on insured shares as of December 31, 2000, as reported by the insured credit unions.

This was the method used in all the fund’s preceding years. Subsequently dividends of $99.5 million associated with insured shares as of December 31, 2000 were declared and paid in 2001.

But then this NOL calculation,  a consistent process  since 1985, was changed by the Board in 2001 as explained on page 21 if the Annual Report:

the deposit adjustment credit unions submit to the Share Insurance Fund to maintain their required deposit level of 1 percent of insured shares is not recorded until March 2002. In March, the equity ratio moved above the normal 1.3 percent operating level established by the Board. 

This delayed recognition allowed the NCUA to omit the required dividend in 2001 because the actual ratio exceeding 1.3% was not recognized until March.

Since the redesign of the NCUSIF’s in 1984, the adjustment to the 1% deposit had always been collected after yearend (as is the case today), but  still recognized in full when calculating the  December 31 NOL.

This change was discussed in the audited footnote 5 which revised the previous 2000 NOL calculation as follows:

The equity ratio at December 31, 2000, was 1.33%, which considered an estimated $31.9 million in deposit adjustments billed to insured credit unions in 2001 based upon total insured shares as of December 31, 2000. Subsequently, such deposit adjustments were excluded and the calculated equity ratio at December 31, 2000 was revised to 1.30%.

Thus the NCUA board gave itself the flexibility to delay recording the 1% true up versus continuing an  established and clearly understood ratio computation followed for almost 20 years in NCUSIF’s audited statements.

The Impact on the NCUSIF Financial Reports

The annual change in OTR from the long standing 50% and the delayed recognition of the 1% true up have given NCUA greater access to NCUSIF funding.

Since 2008, the operating expenses allocated to the NCUSIF have grown at an annual rate of 6.9%.   In contrast, following the change to a “variable” OTR, the operating fees paid by federal credit unions have increased only 3.6% demonstrating NCUA’s  increased use of the NCUSIF for its total budget.

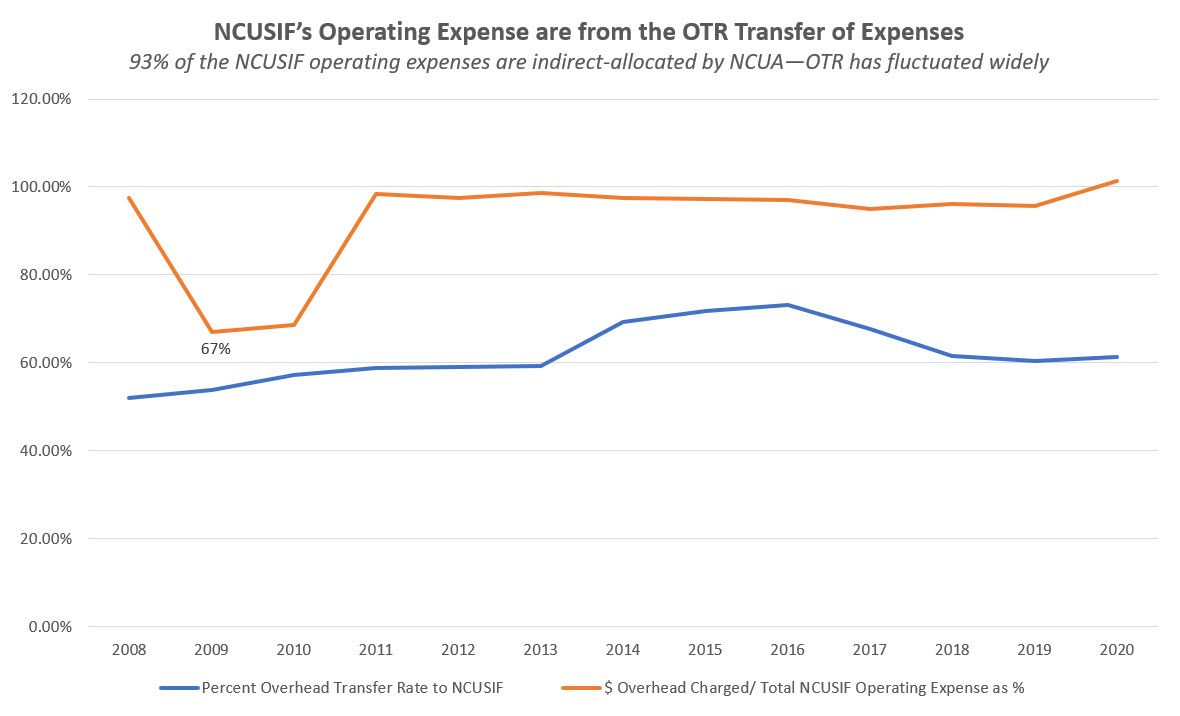
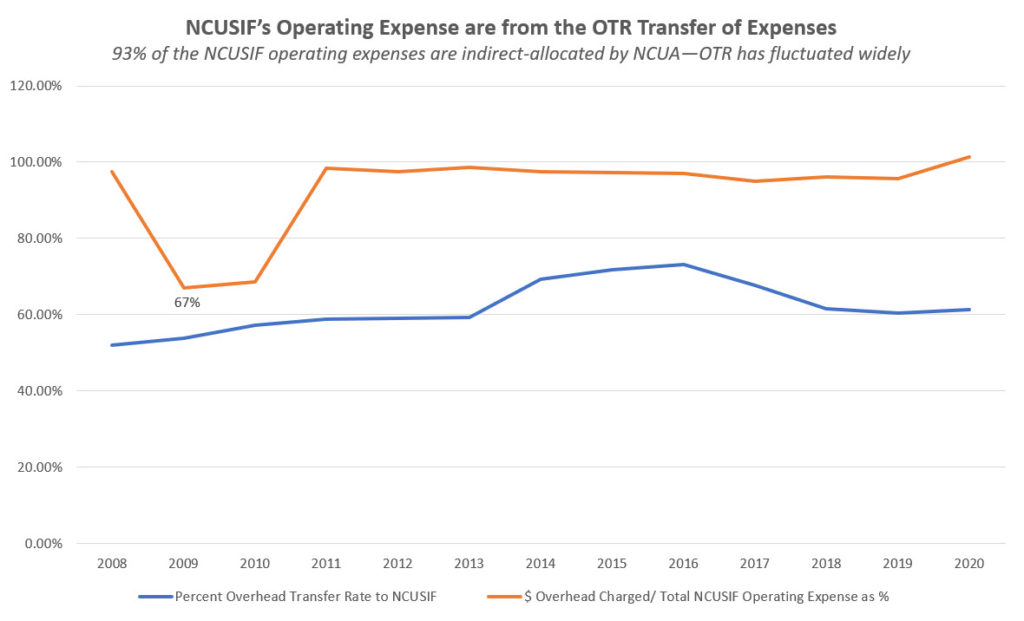
The graph below shows NCUSIF operating expenses are almost all due to the Overhead Transfer with a different rate set each year.

Regaining Accountability for the NCUSIF

Credit unions were prudent to worry about NCUA’s instinct to spend money under its stewardship.  The NCUSIF is meant to be a financial safety net for the cooperative system. Instead it has been converted to a cash cow  anytime NCUA wants to reach in for more money via the allocation process.

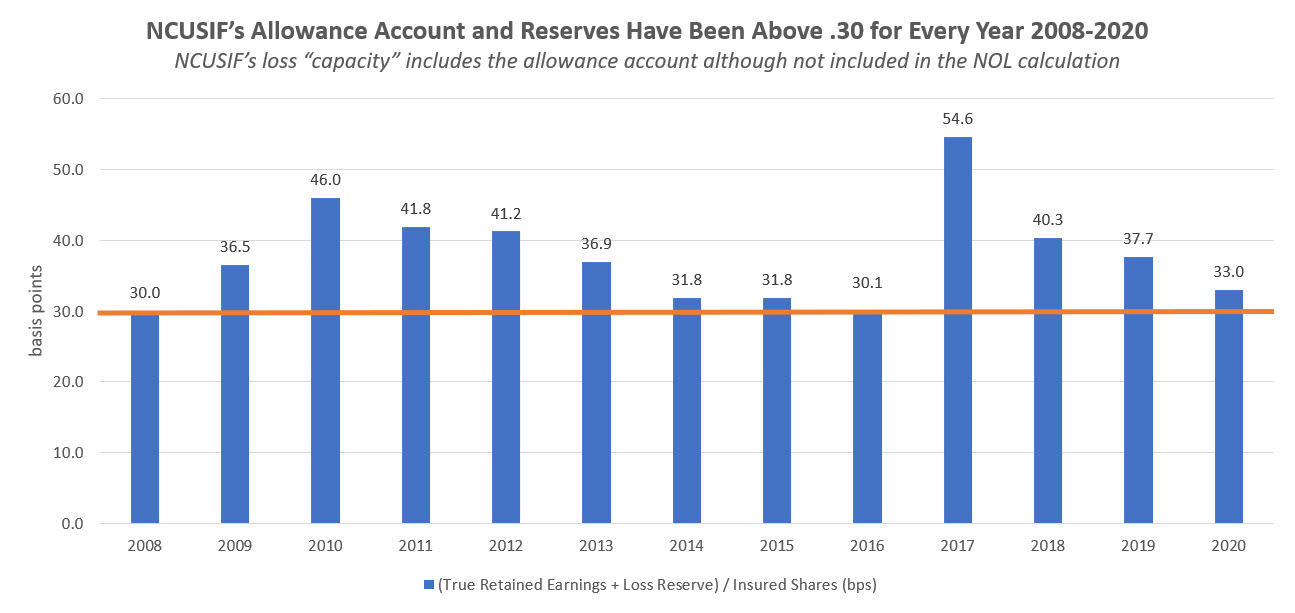
Dividends that would have been paid under the 35- year long-standing 1.3% NOL cap were eliminated when  NCUA simply raised the cap to 1.39 in 2017 and 1.38 in subsequent years.  As many commentators pointed out, there was no objective  data supporting this change.

NCUA’s annual open-ended expense draw compromises the Fund’s primary role as a resource for insurance losses. Before the OTR change in 2001, the NCSIF paid six consecutive dividends. This kept NCUA’s commitment that credit unions could earn a dividend on their 1% investment in years of negligible losses.

Now NCUA takes their toll off the top rather than being limited to 50% a number which aligns with the proportion of state-chartered NCUSIF insured shares.

It is the NCUA board that made the above changes.  Accounting standards can accommodate different ways of presenting financial information.  These statements reflect management decisions, not accounting truths.  The changes in practice described about were not  in the best interests of credit union owners.  Auditors present, but do not approve such decisions.

NCUA’s 2022 budget is up for debate and comment.  The OTR should be set to reflect the proportion of state insured shares, not some opaque, manipulated internal study.  Expense control is a critical for  the proper management of any organization but especially a fund set up primarily to pay for insured losses.

Credit unions  have a duty to  speak up so the Board can right this series of decisions shortchanging the fund’s owners today.

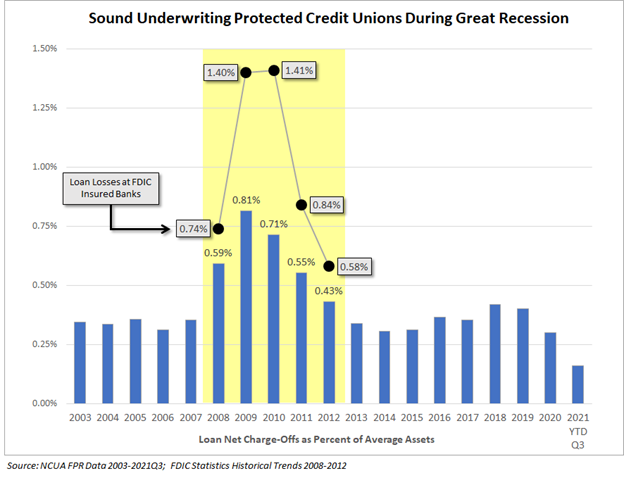
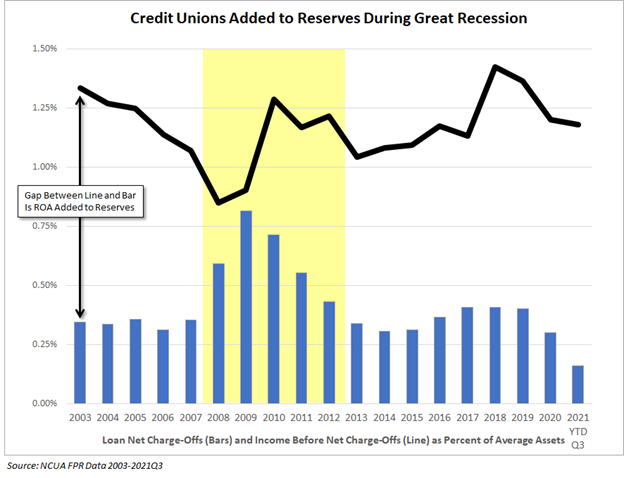
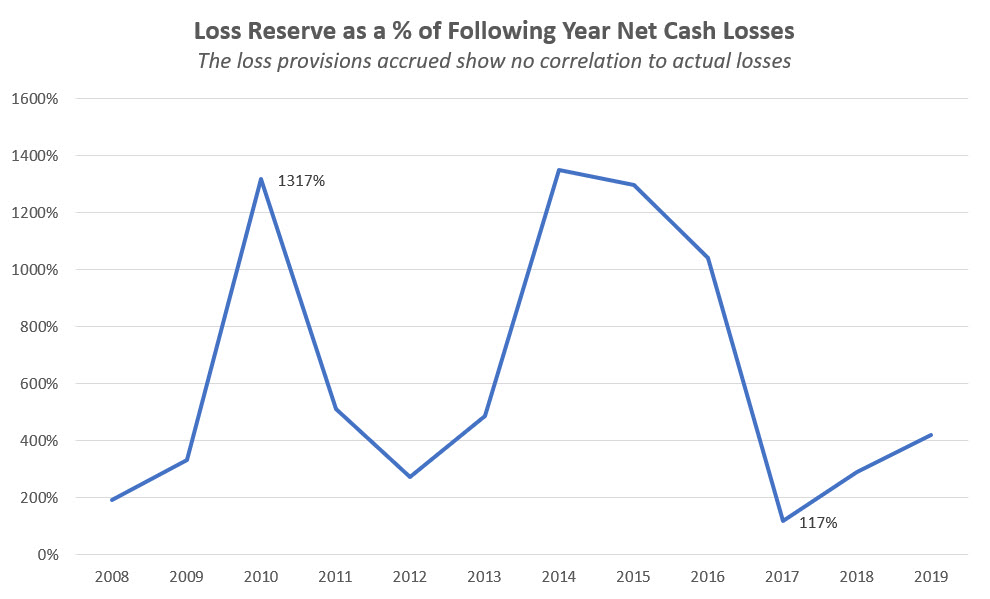
Tomorrow in part 3 I will review the history of NCUSIF losses  to  analyze whether the long standing 1.3% cap and 1% deposit design provide sufficient financial resources for the fund.


The NCUSIF is A Better Way– IF Properly Managed

The NCUSIF’s redesign culminating in the October 1984 NCUA board implementation was revolutionary.   This two-minute excerpt is from NCUA’s Video Network of that historical vote:

NCUA Bd Mtg Approves NCUSIF Redesign: A Better Way .

A Partnership

Board member PA Mack summarizes his approval saying:   I’m ready to support this and think it is an outstanding product as a partnership among government and credit unions.”

NCUA wanted credit unions as partners, with mutual give and take, and together the cooperative system created the most successful federal insurance program ever. 

Can Work Beautifully

When approved by a 3-0 vote, Chairman Ed Callahan congratulated everyone for their efforts and commented:  “This is a very significant thing for credit unions.  This system can work beautifully for credit unions in the future. I think the real challenge goes to you people in NCUA now.  The real secret is in the operations.” 

Callahan believed the power of NCSIF’s redesign was that it clearly invites credit unions into “cooperation” now and as long as the system’s integrity is preserved though proper management.

A Three-Year Process

This redesign did not happen overnight.  It emerged due to the failure of the premium based approach modeled after the FDIC and FSLIC funds founded four decades earlier.  This reassessment was documented in a 120 page report NCUA sent to Congress in April 1983. It featured  comments from all segments of the credit union system. Legislation was drafted with credit unions and sent to Congress in 1984.

NCUA actively encouraged credit unions to support the legislative change.  An NCUA video outlined the plan including the NCUSIF’s financial history since 1971-1984.  This analysis was the foundation for creating A Better Way.

In the 1985, NCUA reported the outcome for credit unions following the first year of this new design:

Dividend of 5%: Because of the fund’s performance . . . for the first time ever the NCUSIF paid a dividend which represents about $30 million in equity distribution. . . The NCUSIF has returned in some form almost $270 million to credit unions: the $84 million equity distribution (when calculating the 1% deposit), the insurance premium waiver for last year, the $30 million dividend and leading into the next year, a $90 million premium waiver.  (Source:  Page 5 NCUSIF 1985 Annual Report)

The partnership approach based on transparent communication with credit unions and immediate return created another system benefit. The radical restructuring proved to be the way to something more– an action  that renewed the entire system’s hope during deregulation and that credit unions still benefit from  today.

The Operations of the Fund

The critical aspect of the NCUSIF’s cooperative design, as noted by Chairman Callahan, is how he fund is managed by NCUA staff.  These four primary responsibilities include:

  • The regular, timely and accurate reporting of the fund’s financial position.
  • Prudent oversight of  NCUA’s operating expenses charged to the fund.
  • The careful management of fund losses to ensure the least possible cost resolution for problems.
  • Intelligent and professional management of the fund’s primary revenue source- the yield on its investment portfolio.

In the aftermath of the 2008-2009 financial crisis a material change occurred in NCUA’s management of each of these responsibilities—all contributing to an increasingly confusing and misleading presentation of the fund’s financial status.

Today I will focus on the 2010 change from private GAAP accounting to Federal GAAP. Future posts will discuss the remaining three responsibilities.

The Ill-suited Change to Federal GAAP Presentation

From 1982 through 2009, the NCUSIF financials were audited and presented following private GAAP accounting standards.  This was a critical part of the NCUA commitment to follow the same reporting and presentation standards it required credit unions to implement.

Credit unions had agreed to the perpetual 1% underwriting of their NCUSIF deposit. In return the NCUA guaranteed the information to properly monitor the agency’s management of these ever- growing 1% deposit assets.

This private accounting standards in 1982 was a departure from the NCUA’s initial practice of relying on a GAO audit which was often late in completion and did not follow GAAP accounting practices.

Why Reliance on Federal GAAP is Inappropriate and Misleads Credit Union Owners and the General Public.

Federal GAAP reporting was intended for use by entities that receive appropriations from the government.   The NCUSIF receives no government funding.  The  unique cooperatively designed fund relies on withdraw-able member deposits as the principal underwriting  source, not an insurance premium expense levied on credit unions.

In Federal presentation the normal balance sheet categories are divided into Intra-governmental accounts and Public accounts, a confusing description at best.  Liabilities have the same misleading divisions.  The Net Position contains a federally  defined Cumulative Results of Operations, sometimes mischaracterized  as retained earnings.  However in federal GAAP this account includes changes in the net unrealized gains and losses on the NCUSIF’s investment portfolio during the year.

Private GAAP does not include this.  As a result the monthly income and yearly audited statements present a completely misleading number from a retained earnings or equity perspective.

The traditional income and expense information is  renamed as Statement of Net Cost.” This presentation is similarly as confusing and misleading as the balance sheet categories. The presentation begins with Gross Costs , followed by Less Exchange Revenues, with a so called bottom line labelled,  Net Cost of Operations.

In 2020, Federal GAAP reported an NCUSIF  bottom line of a $239 million gain; however private GAAP net income was only $32.9 million.  The outcome is that actual retained earnings do not correspond to cumulative results of operations, thus misstating the true NOL when the 1% deposits are added. This annual over or under presentation of “fund equity ” is shown in the following chart.

Federal government accounting  reporting does not appropriately present the fund’s “equity” at yearend

This confusing presentation continues in the other required financial statements. These include the federally prescribed Changes in Net Position and the Statements of Budgetary Resources.   Neither portrays the data needed to understand traditional financial concepts of changes in cash flows, retained earnings or total equity.  These concepts were created for federally appropriated entities.

To see the full 2020 audit report following Federal GAAP presentation, click here.  Pages 13 and 14 are completely unintelligible versus private GAAP presentation.

The standard Federal GAAP presentation is so confusing that when staff updates the NCUSIF financial results to the board, the income statement and balance sheet are converted  to the standard GAAP income and balance sheet formats.

However even this monthly “translated” accounting practice is a mash up of private and federal GAAP concepts.  For example the most recent NCUSIF update showed  a quarterly net income at September 30 of $58.6 million.  The balance sheet account which would include this gain is called the Cumulative Results of Operations.  That account instead shows a quarterly  “loss” for the September quarter of $16 million.   This $75 million total difference is due to the net decline in market valuation of the investment portfolio.

Two Different NOL Calculations in the Audit

These distortions continue even when NCUA calculates the formal audited NOL ratio at yearend.  In the 2020 audit footnote 13  states the NOL is 1.26%.  This number is calculated by dividing the total Net Position of $18.9 billion by yearend insured shares of $1.5 trillion.

However in the same audited statement NCUA presents a different way to calculate the NOL and whether a dividend is due credit unions:

The NCUSIF equity ratio is calculated as the ratio of contributed capital plus cumulative results of operations, excluding the net cumulative unrealized gains and losses on investments, to the aggregate amount of the insured shares of all insured credit unions.  (pg 134 NCUA annual audit for NCUSIF, emphasis added)

Subtracting the net gain of $511 million NCUSIF net investments  at 12/20 from cumulative results of operations gives and NOL, per the above paragraph,  of 1.228 or 1.23%.   Which number are credit unions to believe?  Which NOL calculation determines the dividend?

Why Readopting Private GAAP is Critical

The confusions and misleading calculations shown above are just some of deviations from private GAAP accounting financial presentation and audit scope.

Moreover the misrepresentation even extends to how the 1% required credit union deposit true-up is included in the yearend NOL calculation.

The recognition of the 1% required capital true up was a settled financial practice until the board chose to change this in 2001.  Today that change continues to distort the true NOL.

For example the traditional method for NOL calculation followed from 1984 through 2000 would result in an NOL of 1.32% at 2020 yearend. ( a retained earnings ratio of .32 plus 1%) This is much higher than either of NCUA’s two reported calculation methods in the NCUSIF audit.

This underreporting misrepresents the NCUSIF’s actual financial strength and would deny credit unions a dividend if the historical NOL cap of 1.3% had been in place.

For users of the NCUSIF financial statements, Federal GAAP is confusing and misleading.  The NCUA in fact continues to use private GAAP in all three of its other fund annual audits and monthly presentations.

“Fairly presenting” the NCUSIF results for credit unions requires a return to an accounting system which credit unions can understand so they  can monitor their investment in the fund.

Tomorrow I will look at how NCUA has changed the way it charges the NCUSIF for its operating expenses.  And the consequences on the fund’s financial performance.