The following observations ares from an expert who has worked financial institutions for years. This academic-style analysis uses NCUA and FDIC data.
The author sent this summary comment along with the charts:
Any increase in net worth regulatory requirement is a tax on asset growth. Credit unions must grow to maintain market relevance (i.e., they need income to invest in technology, security, regulation, product development, etc.). Adding to the burden just makes it more difficult for credit unions to fulfill their mission. This is a statement of fact.
The corporate credit union collapse was really a double-whammy to credit unions. Not only did they need to replace reserves due to loan losses, but they had to shoulder the burden of NCUSIF and TCCUSF expense/assessments. Had the system been only holding 7% net worth in the aggregate, it would have been able to overcome economic fallout from the Great Recession without falling below 6%. (see the stress test observation #3)
In any system outliers exist. There will always be a few that engage in activities that put themselves at risk (fraud, credit risk, concentration risk, interest rate risk, etc.). The role of the examiner is to identify those activities and enforce policy to make sure they don’t happen.
Asking everyone to hold more capital, because of a handful of outliers, does not fix the root problem; rather, it allows it to propagate knowing a safety net is in place. At the end of the day, it would be a lot cheaper (and more effective) to increase examinations instead of asking credit unions to hold more reserves.
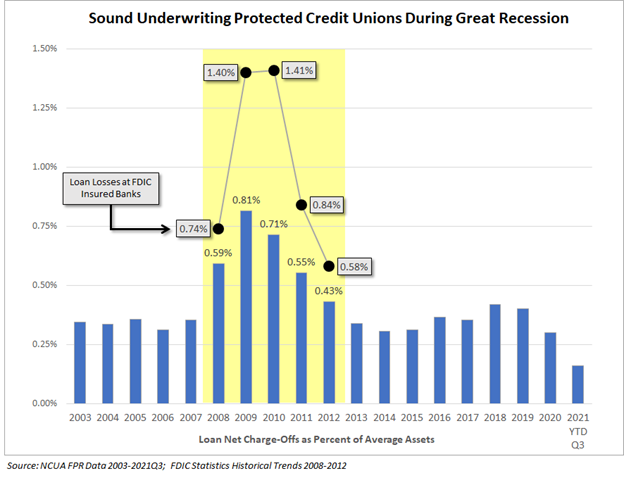
Observation #1: Sound underwriting protected credit unions during the Great Recession years.
The biggest threat to credit union reserves is loan losses because of the speed and magnitude in which they can occur.
The bars on the chart are net charge-offs as a percent of assets (to facilitate comparison with reserves which are also measured as a percent of assets).
In the five years prior to 2008 and the nine years following 2012, loan losses averaged 0.33% of assets with a small standard deviation, a sign of consistent and sound underwriting.
During a five-year stretch from 2008 through 2012, credit unions reserves were hit the hardest, due to economic fallout from the Great Recession. Loan losses averaged 0.62% of assets (almost double the normal rate). However, credit union losses were 37% lower than FDIC insured banks which averaged 0.99% of assets.
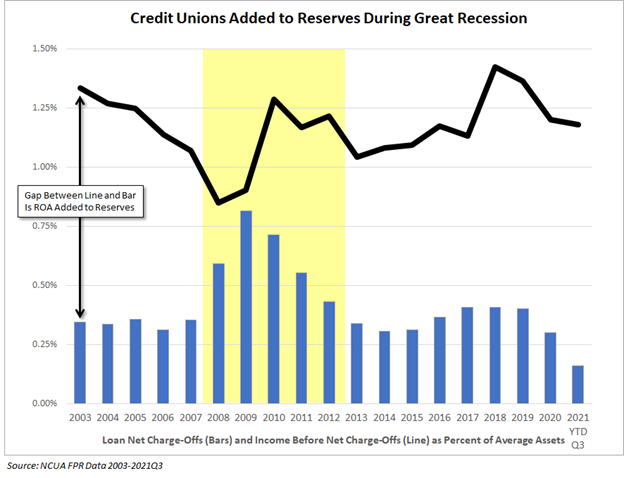
Observation #2: Credit unions added to reserves during the Great Recession years and the economic fallout resulting from COVID 19.
The line on the chart is income before net charge-offs as a percent of average assets. It represents the surplus available to offset loan losses and add to overall reserves (loan loss reserve or net worth). The bars on the chart are net charge-offs, also as a percent of average assets.
The difference between the line on the chart and the bars is the amount added to reserves. This chart includes NCUSIF and TCCUSF expense, to demonstrate the impact of the corporate credit union failure on the system.
Despite elevated loan losses and NCUSIF/TCCUSF expense, credit unions added to reserves every year, including the Great Recession years and during the COVID 19 aftermath.
Observation #3: A stress test shows that at 7% net worth, adequate reserves were present to weather the Great Recession and subsequent corporate credit union collapse.
The line on the chart is income before net charge-offs as a percent of average assets. It represents the surplus available to offset loan losses and add to overall reserves (loan loss reserve or net worth). The bars on the chart are net charge-offs, also as a percent of average assets.
The dots with data labels are the result of a stress test that set net worth at exactly 7% of assets prior to the onset of the Great Recession and subsequent corporate credit union collapse.
Under this real-world stress test, credit union reserves would have dipped below 7% well capitalized but would have exceeded 6% adequately capitalized, even after absorbing just over $8.4 billion in TCCUSF and NCUSIF expense from 2009 through 2013 – the equivalent of 0.89% of credit union assets.
Furthermore, credit unions would have built up ample reserves to absorb the shock to net worth in 2020 and 2021 due to stimulus activity that inflated the liability side of the balance sheet (not the riskier asset side via loans).

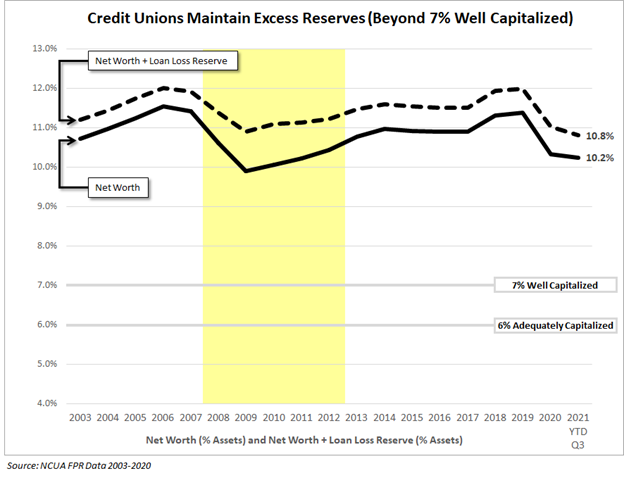
Observation #4: Credit unions have consistently maintained excess reserves beyond 7% well capitalized.
The line on the chart is net worth as a percent of assets. The dashed line is net worth plus loan loss reserve as a percent of assets (i.e., total reserves).
Credit unions have consistently maintained excess reserves beyond 7% well capitalized – and those reserves have been sufficient to offset loan losses resulting from the Great Recession, the subsequent corporate credit union collapse and the rush of stimulus dollars injected into the economy in 2020 and 2021.
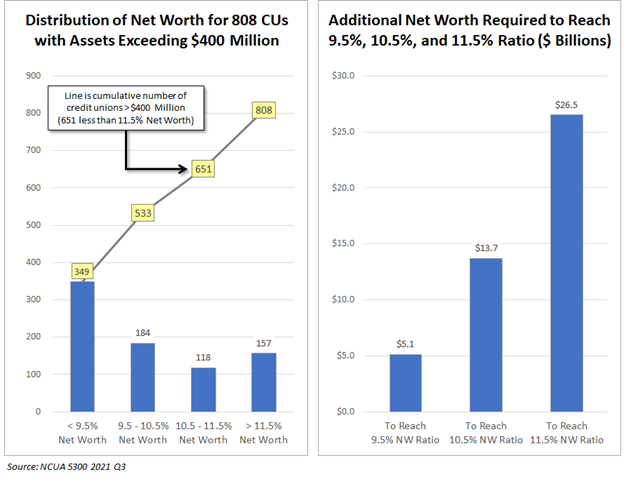
Observation #5: An impact assessment shows that increasing the capital requirement would affect up to 651 credit unions greater than $400 million in assets requiring an additional $26.5 billion in net worth.
Proposed regulation would impact credit unions exceeding $500 million in assets. Credit unions approaching that threshold would also be impacted as they must prepare for crossing it. The impact assessment looks at the 808 credit unions who currently have more than $400 million in assets as of 2021 Q3.
The bars on the chart to the left represent a distribution of credit unions by net worth strata. There are currently 349 credit unions with net worth below 9.5%. The line on the chart represents the cumulative number of credit unions across the strata. There are 651 credit unions with less than 11.5% net worth.
Credit unions will always hold a buffer above the regulatory net worth requirement. System-wide, credit unions currently have a 3.2% net worth buffer (10.2% 2021 Q3 net worth minus 7.0% well capitalized equals 3.2% buffer). To evaluate the impact of an increase in regulatory net worth, an assumption that credit unions will hold a buffer of 1.5% is used. So, if the definition of well capitalized increases to 10.0%, then a credit union would hold 11.5%, a buffer of 1.5%.
The chart on the right shows the amount of additional net worth dollars required to reach a target net worth ratio. If the regulatory requirement increased to 10% then credit unions would hold 11.5%, requiring an additional $26.5 billion of net worth.
Regulatory net worth is a tax on asset growth. This is a statement of fact. It requires resources be directed to reserves held idle on the balance sheet, instead of being used for investment in credit union products and services, technology, security, wages to provide employees with a fair standard of living, DEI (diversity, equity, and inclusion) and community impact initiatives. Increasing the regulatory requirement erodes competitive position and makes it harder for credit unions to fulfill their chartered mission.