Are Credit Unions Still Needed? A Chart Worth Many Words

Visual Capitalist is a website (https://www.visualcapitalist.com) that several times a week publishes graphs illustrating current or long-term trends covering many areas of economic, political and human activity.

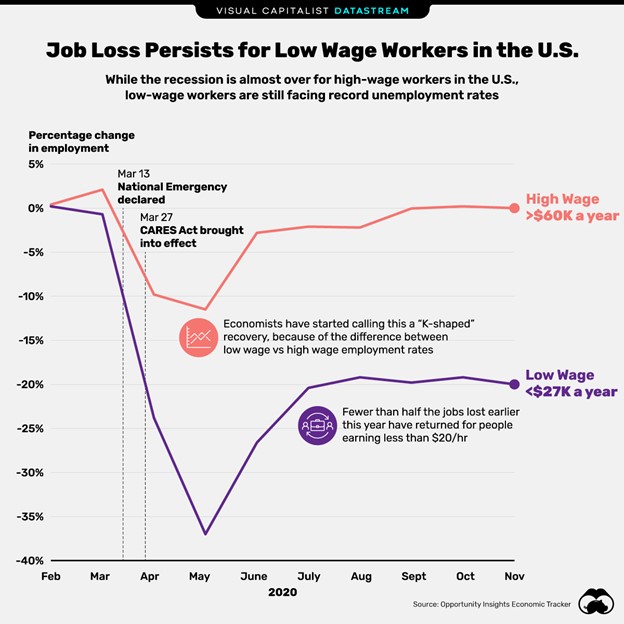
This week they printed the graph below comparing the economic recovery of high versus low wage earners in America. (https://www.visualcapitalist.com/high-wage-vs-low-wage-economic-recovery-us/)

Their full analysis about this “unequal recession” had two conclusions:

  • The economic recession caused by COVID-19 has been especially devastating for low wage workers
  • While the recession is nearly over for high income earners, fewer than half the jobs lost this spring are back for those making under $20/hr

The Credit Union Opportunity

Within current members and in every credit union’s FOM, this divergence in recovery occurs. How can your credit union reach these members and serve them best as we wait for the pandemic to recede?

What Is NCUSIF’s IRR Investment Policy? Is this a Gap in NCUA Board Oversight?

The total assets of the NCUSIF are approaching $20 billion, all of which are invested in U.S. Treasury securities. Yet there appears to be no active oversight of fund management. NCUA has passed a rule, examiner’s guidance and numerous letters to ensure credit unions implement an interest rate risk (IRR) policy. This required practice does not seem to be followed within NCUA.

In the September 2020 NCUSIF statements, the CFO reported the following new fixed rate, fixed term investments during the month:

2 Year at .12%
3 Year at .15%
4 year at .20%
5 Year at .27%
6 Year at .36%
7 Year at . 45%

These yields are at historic lows. There is only one direction rates can go. The only question is when. While the Fed has indicated it will keep this level until the recovery and inflation are well underway, there is no way to know how soon this will be.

Are these prudent investments given these unusual economic circumstances? Does NCUA have an IRR policy for this $20 billion of credit union funds?

The Revenue Implications

Almost all the NCUSIF’s income is from its investments. The revenue from this fixed 7-year ladder is easy to calculate at current rates.

For each $100 million, 10 basis points in yield will generate annual income of $100,000.

For example, in the above investments, the additional annual income by going from a 2- to 3-year fixed term is $30,000 per $100 million.

Extending from a 2- to 7-year term, results in a .33% or $330,000 pickup for the added five years of fixed rate risk.

NCUSIF’s total investment income was $306 million in 2019. Revenue is $211 million for the first nine months of 2020. So, the incremental revenue gain going further out the curve in the current rate environment is inconsequential. Investing $1 billion dollars fixed for 7 years for a .38% gain in yield versus staying short term adds only $3.8 million more in annual revenue.

Shock Testing the Strategy

NCUA requires all credit unions to perform IRR shock tests of their investments to determine the impact on revenue and net economic value (NEV) of the portfolio in various rate scenarios.

The table below shows three different scenarios for a parallel and immediate increase across the entire yield curve for the fund’s September investments.

Term Rate Base Price Up100 Price Up100 % Price Change Up200 Price Up200 % Price Change Up300 Price Up300 % Price Change
4 Years 0.20% 100 96.033 -3.97% 92.069 -7.93% 88.108 -11.89%
5 Years 0.27% 100 95.029 -4.97% 90.06 -9.94% 85.093 -14.91%
6 Years 0.36% 100 94.024 -5.98% 88.051 -11.95% 82.081 -17.92%
7 Years 0.45% 100 93.019 -6.98% 86.041 -13.96% 79.066 -20.93%

A 300-basis point shock test (final column) is the minimum required by examiners. In this shock of the four longest maturities, the decline in principal value is from 12 to 21%. That means investments could not be converted to cash without taking a significant capital loss or a significant “haircut” if used as collateral for borrowing.

This outcome is a critical in evaluating whether the marginal revenue gain out the curve is worth the risk to principal when rates change.

Rates will certainly go up. No one knows the timing, how fast, or how far. The second judgment therefore, considers the probability of increased revenue from higher future rates which would exceed the short-term gain in income by extending out the curve now.

When the Fed begins its move, it will most likely change the current 0-.25 bps overnight rate to a range of .25-.50 basis points. This is the pattern of rate adjustments, both up and down, over the past decade. Therefore, this first change by itself will result in overnight rates in excess of the current seven-year fixed rate return.

Sitting on a $585 Million Gain in Value

The most immediate need for a coherent IRR strategy, is that the NCUSIF’s existing investments now have a market value that exceeds book, by almost $600 million.

Do nothing till maturity and the gain goes away. Sell part of the gains now and the fund records more than enough revenue to meet its projected expenses in 2021.

By shortening the average life with a partial rebalancing, the fund will then be positioned to follow rates up.

Who Oversees NCUSIF IRR Strategy?

Analyzing the risks to principal and income from September’s investment decisions suggests a reassessment of current investment practice is much needed.

Who is responsible for this analysis? Who monitors the relevance and execution of the IRR policy, if there is one?

If this were a credit union, we know for certain what the answers would be. Management drafts and carries out policy. The Board approves policy and monitors performance.

In the case of the NCUSIF, these two critical functions are clouded in bureaucratic fog. The agency is explicit in assigning IRR responsibility for a credit union. Should policy be any less explicit for the NCUSIF? Should this activity be part of the monthly report to the Board?

Where is the OIG?

A quick review of OIG activity would suggest that once again, the OIG is asleep at the switch when it comes to monitoring NCUA’s internal conduct. Here is a report of its audit in 2011 of NCUA’s external review of IRR in examinations.

“In 2011 NCUA’s Inspector General released a report on a “self-initiated” audit to determine (1) whether the National Credit Union Administration’s (NCUA) interest rate risk (IRR) policy and procedures help to effectively reduce IRR; and (2) what action NCUA has taken or plans to take to identify and address credit unions with IRR concerns. To accomplish our objective, we interviewed NCUA headquarters and regional management and staff. We also obtained and reviewed NCUA guidance, policies, procedures, and other available information regarding interest rate risk. In addition, we judgmentally selected five credit unions, one from each of NCUA’s five regions, and analyzed the corresponding examination and supervision reports and related documents. We determined that NCUA has taken steps to identify and address credit unions with interest rate risk concerns.” [emphasis added]

However, the OIG is silent on this topic in NCUA’s internal IRR. NCUA’s “policy and procedures” for its own responsibility, if they exist. certainly call for a similar audit.

Below are the Agency’s requirements for effective credit union IRR practice. They provide a detailed framework for NCUA’s own investment management.

Excerpts from NCUA’s IRR Requirements for Credit Unions from the rule, FAQs and guidance in letters. All excerpts are verbatim.

Why is the Interest Rate Risk (IRR) rule written as a requirement for insurance?

Interest rate risk is a core risk which confronts FICUs; similar risks exist with regards to lending and investments for which regulatory requirements for insurance already exist. As a requirement for insurance the rule applies to all FICUs. The rule combines the many elements of asset liability management into a comprehensive framework for managing core risk.

IRR Policy

Who is responsible for the adequacy of the policy?

The Board of Directors is responsible for a credit union’s IRR policy.

What should the policy include?

A written policy should:

  • Identify parties responsible for review of the credit union’s IRR exposure.
  • Direct appropriate actions to ensure that management identifies, measures, monitors, and controls IRR exposure.
  • State the frequency with which monitoring and measurement will be reported to the board.
  • Set risk limits for IRR exposure based on selected measurement. (for example, GAP, NII or NEV)
  • Choose tests such as interest rate shocks, that the credit union will perform using the selected measures.
  • Provide for periodic review of material changes in IRR exposure and compliance with board approved policy and risk limits.
  • Provide for assessment of the IRR impact of any new business activities prior to implementation.
  • Provide for an annual review of policy to ensure it is commensurate with size, complexity and risk profile of the credit union.
  • When appropriate, establish monitoring limits for individual portfolios, activities, and lines of business.

Oversight and Management

How should management implement the Board policy?

Management should:

  • Develop and maintain adequate IRR measurement systems.
  • Evaluate and understand IRR exposures;
  • Establish an appropriate system of internal controls (risk taker should be separate from those measuring, i.e. does the modeler also pick the investments?);
  • Allocate sufficient resources for an effective IRR program (should include competent staff with technical knowledge of the IRR program);
  • Identify procedures and assumptions involved in the IRR measurement system (i.e. the credit union’s IRR model inputs);
  • Establish clear lines of authority for managing IRR; and
  • Provide a sufficient set of reports to comply with Board approved policies.

When should I consider my IRR management program as being effective?

Your program will be considered effective when it has a well-defined policy and it identifies, measures, monitors and controls interest rate risk, and you use these to guide decision making. Your program should be able to adjust as products are added or increased, interest rates shift, balance sheet changes and capital positions change.

Assumptions For IRR Policy

Projected interest rate assumptions are a critical part of measuring IRR and may be generated from internal analysis and/or external information-provider sources. Internal interest rate forecasts, which may be derived from implied forward yield curves, economic analysis, or historical regressions, should be documented to support the assumptions used in the analysis. Key rate assumptions that should be considered include assumptions for relevant market rates, repricing rates, replacement interest rates, and discount rates.

Stress Testing

Stress testing, which includes both scenario and sensitivity analysis, is an integral part of IRR management. Scenario analysis simulates possible outcomes given an event or series of events, while sensitivity analysis estimates the impact of change in one or only a few of a simulation model’s significant assumptions.

With IRR stress testing, the modeled scenarios involve changing interest rates by defined amounts and potentially severe magnitudes. At a minimum, standard stress tests typically include instantaneous, parallel, and sustained shocks in the yield curve of +/- 300 basis points. [emphasis added]

Parallel and static interest rate shocks in the yield curve of only +/- 300 basis points may not be sufficient to adequately assess IRR. In addition to the standard IRR policy limits, a credit union must determine the number of potential interest rate movements, including meaningful stress situations for which it will measure and analyze its IRR. In developing these appropriate rate scenarios, management should consider a variety of factors, such as the shape and level of the current and historical term structure of interest rates.

Operational Considerations

The use of stress testing is an essential discipline within the IRR management process. By generating a variety of stress test results, a credit union gains critical insight into the specific factors that have a material impact on the risk measurement results. Risk management decisions are better supported when the decision makers have a range of information available to guide risk mitigation actions.

The Ups and Downs in Consumer Credit “Hardship”

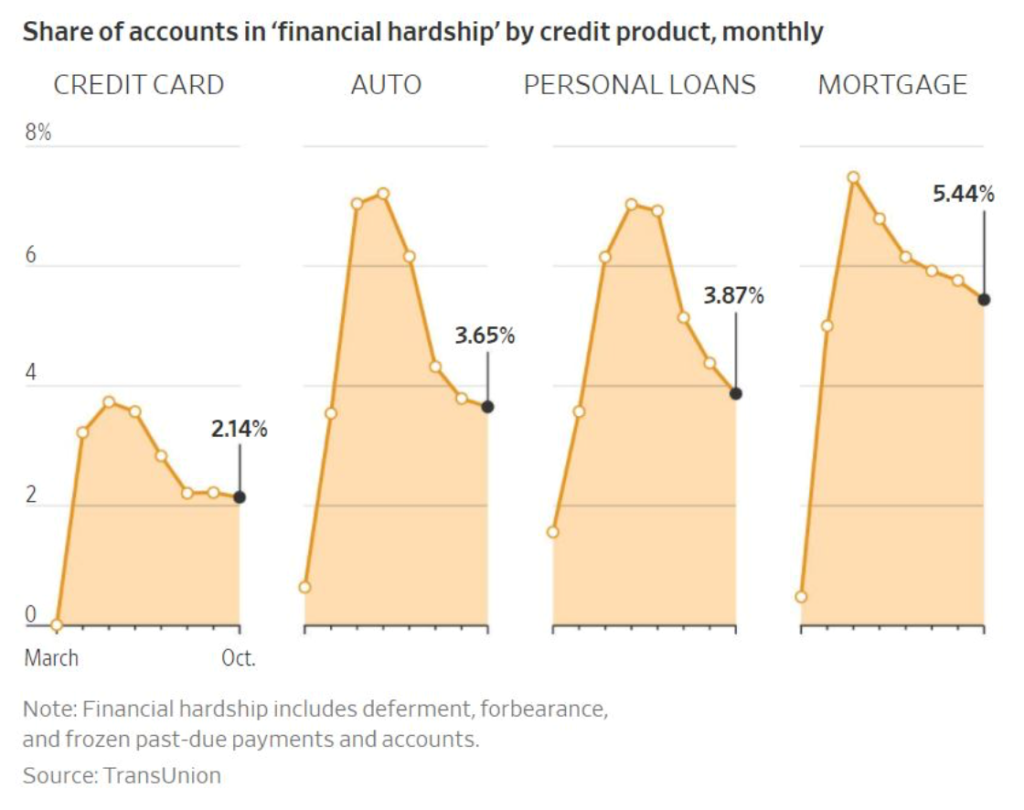
The chart from TransUnion below shows how quickly consumer credit defaults rose and then suddenly declined from March through October 2020.

The September credit union data shows the industry has not seen dramatic upticks in total delinquency and charge offs. However some of these deferrals and forbearance accounts may not have been included as past due.

Key questions include why the sudden turn around? Was it stimulus relief programs? Economic recovery?

Depending on how one interprets these rises and falls will provide some guidance about future trends. For example if Congress fails to pass additional relief, will the down turns reverse? Or is the employment recovery the key to lower rates of credit hardship?

It’s NOT a Wonderful Life or Can Miracles Still Happen?

On December 28th,  the Monday after Christmas, the 85-year, $35 million  Post Office Credit Union (POCU) in Madison may come to an end.   The savings and loans of its 3,196 members and their abundant reserves (22% net worth) will be transferred in due course to the $26 billion PenFed Credit Union in Virginia.  Their new financial “partner” is 850 miles distant and 742 times larger. They would join an already existing membership of over 2 million.

Why should credit unions care?  After all UPS, Federal Express, DHL and even Amazon can fill the needs if the local Post Office itself were to close.  Same with financial options–aren’t there plenty?

Member-owned cooperatives fill a special niche in every community.  The members pool their savings to provide loans to members and businesses with local control and leadership.  Founded during the Depression, POCU serves member needs with services guided by familiarity and circumstance.  Especially in a pandemic.

It’s Madison, Not Bedford Falls

But alas, Madison is not the Bedford Falls of the Christmas film It’s A Wonderful Life. No Clarence, or guardian angel, has appeared to “ring a bell” asking  for a public hearing.  Or to demonstrate what the future for  members and the community will be without POCU.

And there is no George Bailey to stand against Potter’s acquisitiveness.  For the CEO of POCU will choose between receiving a five-year $650,000 sinecure or  immediate cash severance of $437,000 while turning over his leadership responsibility to another firm via merger.

Will there Be a Rerun?

Three generations of members have supported POCU to be always present for them.  But no rerun of It’s A Wonderful Life may happen next year.

Unless there is an unexpected intervention. Do I hear a bell ringing signaling another angel’s presence?  A real life Clarence to help members see  life without POCU?

Such an event would  fulfill the spirit of this timeless movie. Except it would be a real-world “Madison miracle”  this Christmas time.

Seeking 25 Wisconsin Credit Union Faithful

On December 28th, the 85-year, $35 million Post Office Credit Union (POCU) in Madison, Wisconsin will cease to be an independent charter. After voting, the 3,196 members and their savings, loans and abundant reserves (22% net worth) will be transferred to the $26 billion PenFed Credit Union in Virginia.

Why care? After all UPS, Federal Express, DHL and even Amazon can fill the needs if the Post Office itself were to close. Same with financial options–aren’t there plenty?

Members Uninformed What Their Vote Enables

The members are not informed about what is happening by their required vote. The intent of the organizers of this action is to announce the deed as late as possible, limit the voting period to minimum required interval, and make the process appear as just another routine event in the life of the credit union—as the members are asked to drink the cooperative Kool Aid.

What POCU’s members are approving in surrendering their charter via merger is:

  • A new board of directors, whom they do not know and have never been told about.
  • A new senior management team who has not been identified or even presented.
  • A new business model (virtual), very different from their current one—PenFed is 742 times larger and serves over 2.1 million members.
  • Accepting a service profile with no specific information of any changes in prices, services and fees. The five examples given are all INCREASES in fees.
  • Loss of all control for any local service, employment, or business initiatives. All references to such are open-ended and subject to PenFed future review, including the $50,000 per year local contribution.

Joining a Harem

In summary, this is an arranged marriage, agreed in secret in April. The bride was informed in October. And still knows nothing about the groom and what will happen after the wedding. POCU will become just another junior member of PenFed’s credit union harem of 19 other charters.

Oh, and the broker of the deal, who had the authority to sign for the bride to protect her best interests, will then get to choose between a five-year $650,000 sinecure, or an immediate $437,500 payoff for his actions. PenFed is paid a dowry of $7 million to marry this unwitting bride. The family of bride will go away empty and the community will no longer recognize them as members.

Whose Responsibility?

The reaction to this situation in Wisconsin reminds me of a story that Dick Cavett once told. During a performance of Hamlet in Central Park, NY City, when they got to the part where he stabs Polonius, eight people got up and left because they didn’t want to get involved.

If those with the power, position or privilege fail to speak about this event, will these members ever trust credit unions again? Or as another American leader once said, “In the end, we will remember not the words of our enemiesbut the silence of our friends.

No matter our intentions or inattention, we are all stained. We watch an anti-democratic process fueled by self-interest not member well-being. Statutory terms such as “good faith,” “specific plans,” “best interests of the members” and the legally required “consent” of regulators is devoid of meaning. As the precedents of these calculated takeovers expand, credit union leaders shrug their shoulders accepting this as just the way of the world.

By our inaction we endorse the preying upon our industry by our own.

This acquisitive behavior is an assault on everything cooperatives stand for. It brings the capitalist model’s full range of animal spirits with none of the market’s checks and balances.

The Wisconsin statute requires a petition by 25 residents to require a public hearing on this event, should the DFI not do so on its authority. That hearing would give all those interested in the future of cooperatives to give the Board of POCU and PenFed to make their case publicly not behind closed doors.

Are there 25 credit union believers who are willing to ask that this activity be done in the full light of public debate and request the DFI hold a hearing?

The Nose of the Camel?

At FDIC’s December meeting, the Board approved an updated regulation relating to interest rate limits on banks that are less than well capitalized.

The changes are intended to provide flexibility for institutions subject to the interest rate restrictions and ensures that those institutions will be able to compete for deposits regardless of the interest rate environment.

One way this flexibility is enhanced according the explanatory Fact Sheet is:

MORE COMPREHENSIVE NATIONAL RATE – The final rule defines the National Rate to include credit union rates for the first time.

  • “National Rate” is defined as the weighted average of rates paid by all IDIs and credit unions on a given deposit product, for which data are available, where the weights are each institution’s market share of domestic deposits.

The Level Playing Field

Is this what bankers mean by “a level playing field?” To implement this rule, the FDIC camel must poke its nose into co-ops’ tent to track credit union rates on “given deposit products.” Be alert for more “leveling” activities in the future.

Underwriting Cooperative Designs

The list of the top 100 US cooperatives by total revenue lists only five credit unions.

Do you know the co-ops operating in your communities? How are credit unions supporting cooperative solutions especially with needed, local  startups?

A proposal  from Finland where 90% of the population belongs to a co-op

It would be fair to say that the American credit union movement was born from a unique way that Edward Filene did charity. He helped reduce obstacles people face when they try to help themselves by setting up cooperatives. As it became harder and more expensive to start new credit unions, this tradition started to fade away. It could be more complex for credit unions to help people set up cooperatives, other than credit unions, because it requires different expertise. But I hope credit unions would ask themselves – if we are not carrying on Filenes distinctive civic tradition of helping start new coops, who is? 

It’s common for credit unions to donate to food banks and other local charitable efforts.  

What if some of those donations would be used to give food cooperative coupons/vouchers to credit union members who are struggling economically? Ideally the food cooperative would also provide opportunities to get further discounts by volunteering to help run the business, as is common in grocery coops. 

I think many would find this sort of mutual self-help more dignifying than being given food from a food bank – not that there should be a stigma in doing so. Perhaps especially men who are reluctant to get assistance would find this psychologically more helpful. Abstract models of comparing the logistical cost-effectiveness of providing food through food banks or food cooperatives can’t capture this difference. But can credit unions? 

It could be used to demonstrate the cooperative difference of credit unions in a way no advertising campaign could. The Open Your Eyes campaign remaining budget was $50 million. What if there was an equally large campaign, where 5 million credit union members would use a $10 coupon in a new cooperative business?


It doesn’t have to be limited to food cooperatives either. Maybe a couple who open up a joint-account could be given a pair of movie tickets that could be used in a local cooperative cinema. The possibilities are endless.  

Leo Sammallahti

AN EYE-OPENER: New Study on Size and Cost Efficiency

This month the FDIC released a 27-page study entitled “Economies of Scale in Community Banks.”

The authors analyze all community banks less than $10 billion in assets from 2000 to 2019 to measure their actual trends in economies of scale and productivity by asset size.

The major findings are below. Over two thirds of the paper present the analytical method and data used to develop their conclusions. The most significant conclusion in my view is:

“. . .our results suggest efficiency gains accrue early as a bank grows from $10 million in loans to $3.3 billion, with 90 percent of the potential efficiency gains occurring by $300 million”

The Relevance for Credit Unions

The average credit union size on September 30, was $345 million. That is the sweet spot for peak operating gains in the study. While credit unions would not mirror the balance sheet and business model of a typical community bank, the overall conclusions seem applicable.

Moreover, it is probable that the greatest gains in efficiency occur at an ever lower average asset range in coops for three reasons. Credit unions have a consumer-focused lending specialty, which the authors cite as a factor in greater efficiency. They do not have to manage the complexity of paying federal or state income tax. Finally, credit unions achieve economies of scale and efficiencies by cooperating in local and national CUSOs that bring members convenience no single bank or firm could duplicate with its own resources.

Credit unions are undergoing some of the same consolidation pressures described for banking. The study provides needed insight for two much talked about issues in the credit union system. One is what is the ideal size for operational competitiveness. The finding that a range of $300-600 million in assets achieves 95% of efficiency gains, is easily within reach for many credit unions’ business models. Secondly, larger size does not create major gains in efficiency.

In fact, there may even be a cap on size ($3.3 billion) after which diseconomies of scale occur, that is increasing expense ratios. An example of this would be the dramatic performance decline in PenFed, the industry’s third largest institution, as it grew by $7.5 billion over the past five years. This is documented in the analysis “PenFed’s Spurious Strategy.”

The Problem We All Share Part I: PenFed’s Spurious Merger Strategy

In the extracts below, emphasized (bolded) text focuses on the most important conclusions presented by the FDIC authors.

Abstract Summary

Using financial and supervisory data from the past 20 years, we show that scale economies in community banks with less than $10 billion in assets emerged during the run-up to the 2008 financial crisis due to declines in interest expenses and provisions for losses on loans and leases at larger banks. The financial crisis temporarily interrupted this trend and costs increased industry-wide, but a generally more cost-efficient industry re-emerged, returning in recent years to pre-crisis trends. We estimate that from 2000 to 2019, the cost-minimizing size of a bank’s loan portfolio rose from approximately $350 million to $3.3 billion. Though descriptive, our results suggest efficiency gains accrue early as a bank grows from $10 million in loans to $3.3 billion, with 90 percent of the potential efficiency gains occurring by $300 million.

Introduction

Economies of scale occur when the per-unit cost of production falls as the number of units produced increases. In the context of banking, scale economies exist when the cost per dollar of loans (or assets) declines as the number of loans (or assets) increases. An efficient bank is operating at the lowest cost per dollar of assets or loans, , , ,

Our estimates are not causal and do not predict how a bank’s costs would change were it to change in size. We find evidence, however, that the overwhelming majority of any gains from increasing a bank’s loan production from $10 million to the cost-minimizing loan portfolio size of $3.3 billion accrue early in the growth process. Our nonparametric results suggest that once a loan portfolio reaches approximately $300 million, a bank has achieved about 90 percent of the potential efficiencies from increased scale; by $600 million, a bank has achieved about 95 percent of potential efficiencies. . . .

Our analysis focuses on community banks—banks with less than $10 billion in assets—as these banks comprise the vast majority of banking organizations. Approximately 97 percent of all banks in the United States have less than $10 billion in assets, and roughly 90 percent of those have less than $1 billion in assets. The consolidation trend in the industry has differentially affected community banks. The number of small institutions—those with less than $100 million in assets—has declined by 92 percent since 1985. Much of the debate about bank consolidation centers on the largest financial institutions, primarily those some argue are “too big to fail.” But as consolidation in the industry has persisted in recent years, some have begun to turn the “too big to fail” designation on its head and question whether small community banks are “too small to succeed.”

Conceptual arguments that support this notion are often based upon the economics of scale. Some have suggested that increased regulatory burden affects small banks in particular because regulatory compliance cost is a relatively larger item in a small bank’s finances. Likewise, banks that operate in limited geographical areas may find expansion into new product lines less profitable. Another possibility is that technological investments, for example in credit scoring and model-based lending, may not offer enough upside to justify the investment cost for small banks to transition from slower, more cost-intensive business practices (i.e., relationship lending).

Consolidation that shifts assets from small to large banks is more than just a rearrangement of resources. Small and large banks are not interchangeable; a single $1 trillion bank is not the same as one thousand $1 billion banks. Small banks are often built around a relationship-lending business model. Bankers acquire costly but valuable private information about their customers and make lending decisions using this expertise. In contrast, large, remote banks often lack personal relationships with customers and knowledge about the local community, instead relying on a standardized approach to lending. Customers that are good credit risks to a small bank may be unable to obtain credit from a large bank that lacks local knowledge.

As the number of small banks has declined, concern about the future of small banks has extended to the future of small businesses. Small businesses generally obtain loans from small banks, especially when the businesses are in their infancy. The report of findings from the FDIC’s Small Business Lending Survey states that large banks are more than five times more likely than small banks to require minimum loan amounts for the primary loan products provided to small businesses and eight times more likely to use standardized small business loan products. Small banks are also roughly five times more likely than large banks to underwrite loans to start-up small businesses differently These businesses are sometimes described as the engine of economic growth in the United States, so a decline in credit availability to such businesses could affect the real economy.

The fate of small banks also portends that of the communities in which they operate: Kandrac (2014, p. 23) finds meaningful feedback from the failure of a bank and local economic performance, stating, “The disruption of banking and credit relationships is an important channel through which bank failures affect economic performance.” Scale economies in banking thus transcend the domain of business policy into that of public policy. . . .

Conclusion

Consolidation and growth have been hallmarks of the banking industry since the 1980s. The number of institutions has decreased by more than two-thirds while the size of the remaining institutions has increased. Although the problem of “too big to fail” has been frequently discussed within the corridors of government, academia, and the media, community bankers have begun to question if a “too small to succeed” problem also exists. Such concerns are commonly motivated by notions of economies of scale, whether due to cost efficiencies, expanded business opportunities, or the allocation of regulatory costs across a wider asset base.

Using financial and supervisory data on banks and thrifts with less than $10 billion in assets, we study economies of scale within the banking industry using nonparametric kernel regression and translog cost estimation. Our estimation period spans both sides of the financial crisis, enabling us to distinguish pre-crisis trends from post-crisis trends. We find that total costs have generally been declining over time. The crisis temporarily halted this trend, at least for some institutions, but the trend resumed in force post-crisis. With economies of scale, lending specializations matter: agriculture banks show less evidence of scale economies than commercial banks, while mortgage banks display the strongest signs of economies of scale.