
(Part 3 of 3 on the NCUSIF , A Better Way for credit union share insurance)
In 2010 GAO reviewed the FDIC’s financial statements for 2008 and 2009 (report 10-705). The summary, What GAO Found, contained the following comments:
“Because of a material weakness in internal control related to its process for estimating losses on loss-sharing agreements, in GAO’s opinion, FDIC did not have effective internal control over financial reporting . . As of December 31 2009 the DIF had a negative fund balance of $20.9 billion and it had a negative 0.39 percent ratio of reserves to insured deposits.”
This was the third negative position for the fund since deregulation. In the most apocalyptic and highly erroneous NCUA projections about the corporate crisis during (and after) the Great Recession, none projected the NCUSIF would ever be in a deficit position.
After these two significant economic downturns in one decade, the NCUSIF stands tall, stable and resilient. However current NCUA Chairman Harper has openly called for the NCUSIF to be changed so it can mirror the FDIC-an entirely different financial design.
His suggestions show a lack of knowledge about how the NCUSIF has succeeded in an environment that has seen every other federal deposit insurance premium-based system fail.
NCUSIF’s Record in Recent Crisis
The 13-year period from 2008 through 2020 includes two serious economic downturns.
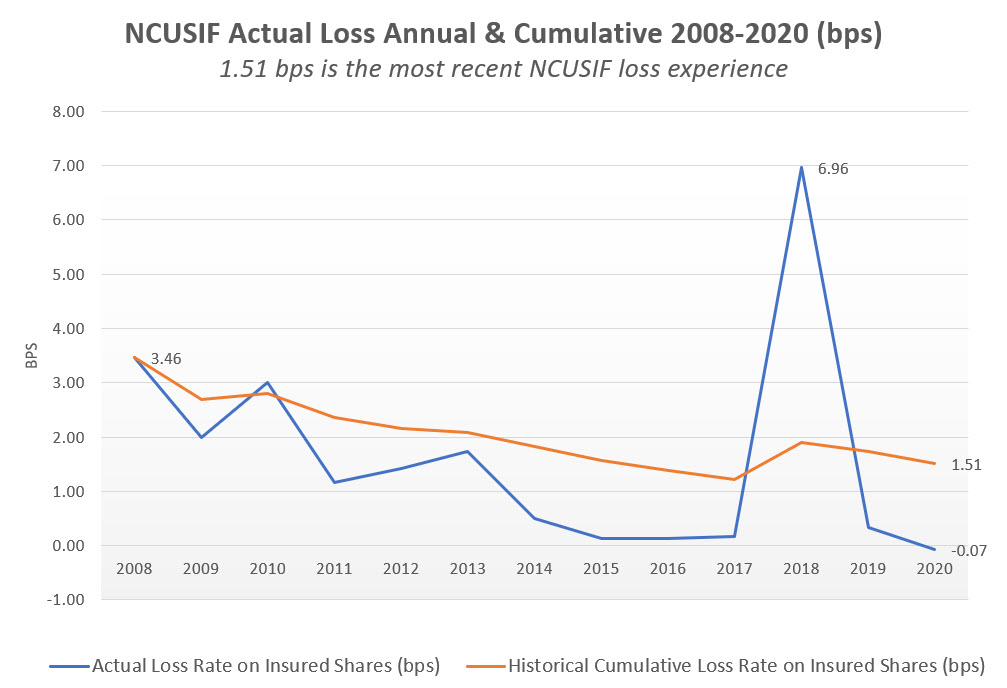
The cumulative insured loss rate for credit unions during this period is 1.5 basis points(bps) as shown below. The annual losses range from 0 in 2020 to 6.96 bps when the taxi medallion losses were recorded in 2017.
The NCUSIF’s financial design rests upon the 1% deposit underwriting which grows proportionately with the insured risk plus an equity cushion that has had a traditional cap of .30 basis points of insured shares.
The board is required to manage this equity level between .2 and .3. If the NOL is under 1.2%, then the board must present a plan to return to this range. Above the 1.3% cap (or other limit set by the board to a maximum of 1.5%), the board must pay a dividend to credit unions to reduce the equity to 1.3%.
Loss Provision Estimates Way off Mark
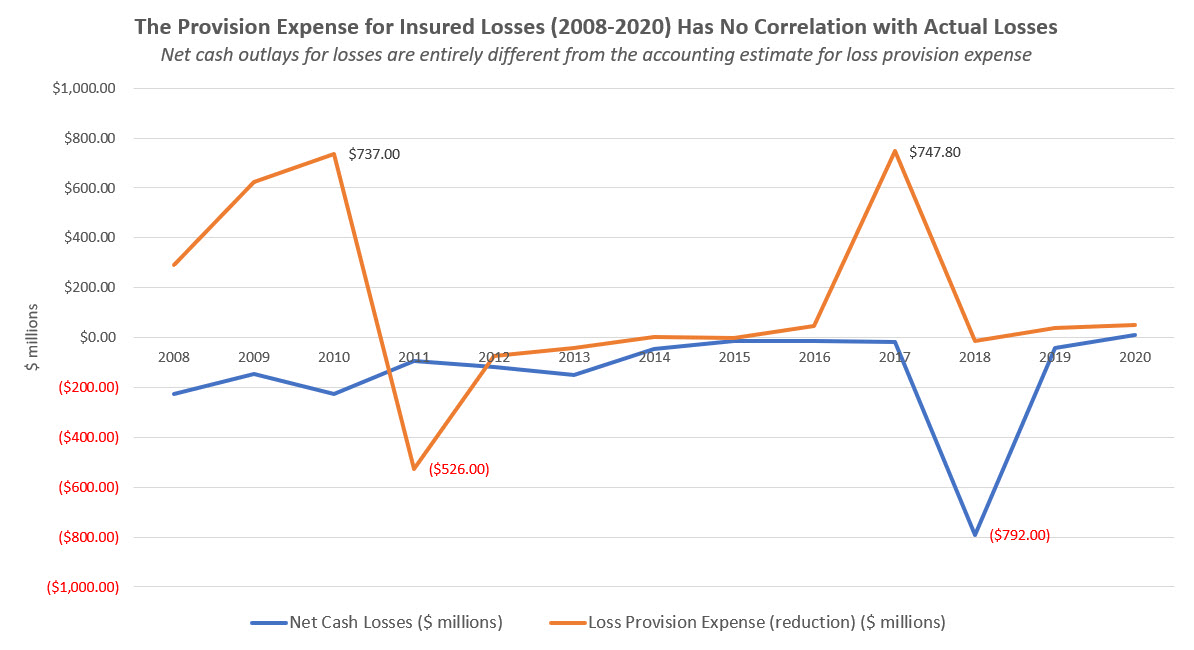
The fund has never incurred losses close to this 10 basis point range. However NCUA’s loss estimates have often been spectacularly in error. This graph shows that net cash losses reported in audits have no relation to provision expense.
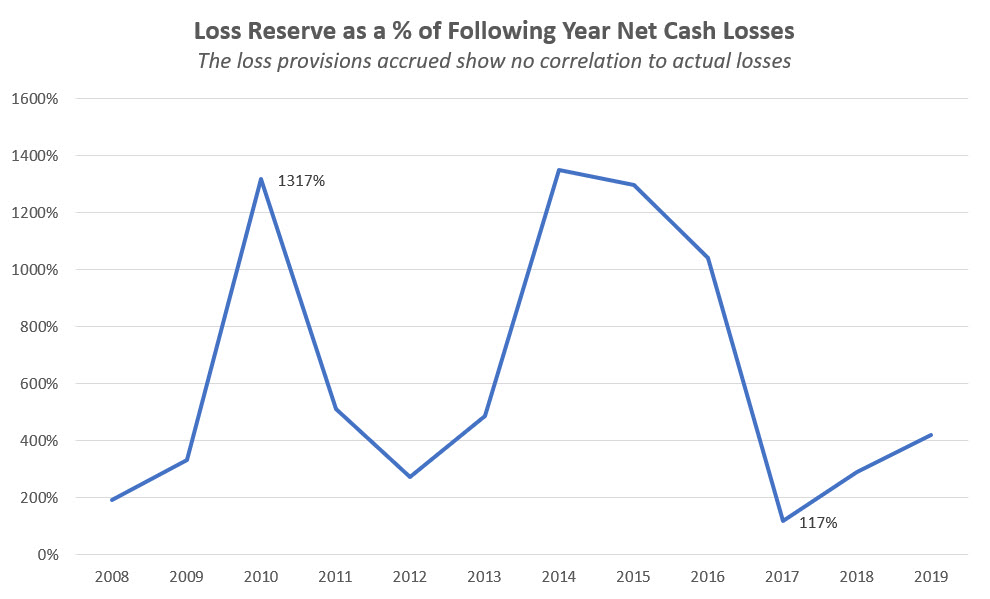
The next chart shows how the much the overfunding of reserves compares to actual losses.
The yearend loss reserve has fluctuated wildly exceeding subsequent actual cash losses by over 10 times in multiple years (1,000%).
These wide disparities between actual losses and provision estimates require subsequent reserve adjustments. These create very misleading financial bottom line results. The provision expense, subtracted from or added back to earnings does not present actual loss experience in a timely and consistent manner.
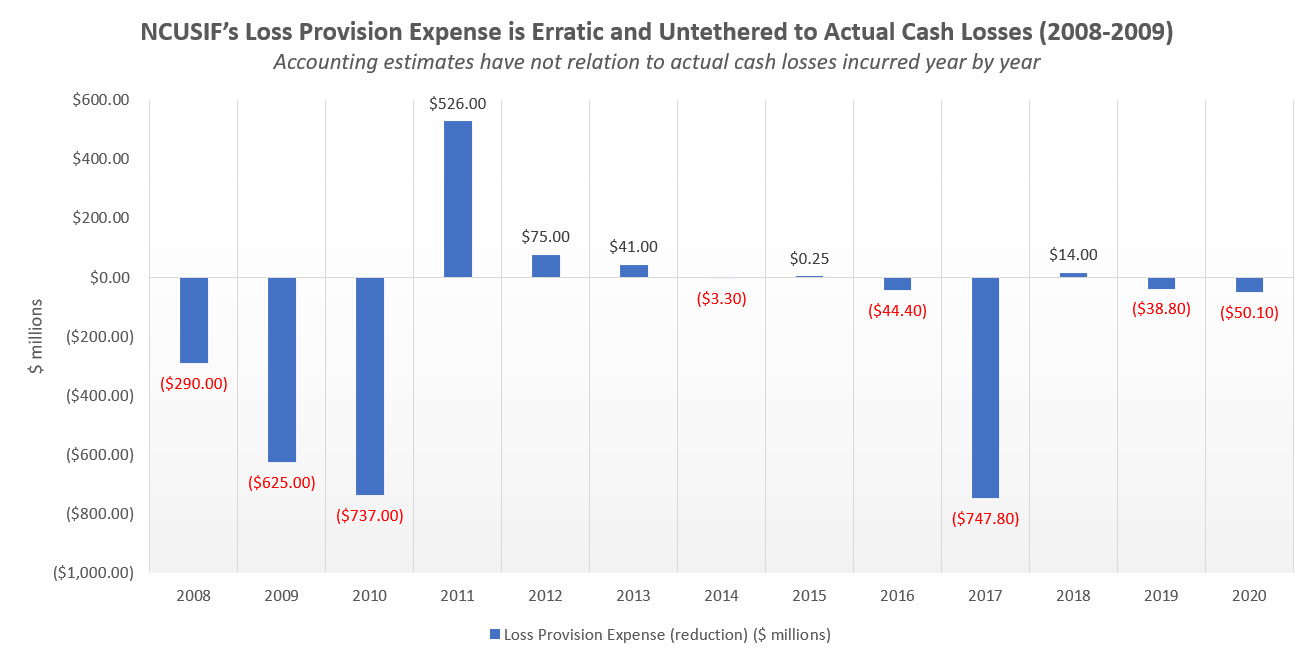
The fund’s structure is more than adequate for insured credit union losses. What is most ominous is that NCUA seems to have no consistent, objective and verifiable method for setting the loss reserve. That is a management problem, not a fund design issue.
When the annual operating expenses of 1.8 basis points are added to the 1.5 basis points, total costs average 3.3 basis points. As outlined earlier, the most persistent increasing expense is NCUA’s overhead transfer, not the costs from insured loses. This expense should be more controllable but has in fact become an increasing funding source covering almost two thirds of NCUA’s annual budget.
What About Revenue?
Costs are covered by revenue. In addition to the two costs above, income is required to maintain the retained earnings portion of the NOL growing at the same pace as share growth to keep a ratio in the .20-.30 equity range.
The math is easy. An example. Assuming $1.5 trillion of insured shares, a cash loss rate of 1.5 basis points requires $225 million of income. As investments equal 1.3% of insured savings, the an investments yield 1.2% covers losses. To pay the 1.8 bps overhead expense adds another 1.4% for a 2.6% yield to cover all costs in the most 13 years.
If the long term growth rate is 6.5% of insured savings, an additional yield of 1.3% is necessary to maintain equity. Using just the last decades results would seem to require a 3.9% yield to sustain the funds NOL.
But this return on investments is not required in most normal years. And a far lower yield, as in the 2021 of 1.23%, can still result in a very strong bottom line. Here’s why.
First, average insured losses at 1.5 bps are much higher than the long-term historical outcome. The 13-year experience reflects two unusual events: the Great Recession of 2008-2009 and the taxi medallion losses. If those three years removed from the average, the average insured losses are far below 1 basis point.
In 2021, insured share losses have been zero and there have been net recoveries from previous loss expense provisions. In 2020, there were nil insured losses. In the previous three decades prior to 2009, insured losses were often zero and far under the most recent period’s 1.5 bps.
Overhead expense can be controlled. It has grown at the same rate as insured shares (6.5%) because NCUA has transferred a disproportionate amount of its budget increase in every year to the NCUSIF—over 62%. If the NCUSIF expenses grew at the same percentage as NCUA’s overall budget, this would reduce the 1.8 basis point portion significantly. Moreover the growth in the investment portfolio shows that in 2021, the yield needed to cover this year’s projected $195 million OTR is only 1 bps.
Finally the equity ratio is a range of 1.2-1.3. It can and has historically varied between a low of 1.24 to the cap set by the board in the past 13 years. In other words a 1 to 2 basis point variance in yearend NOL is normal. And if there is a truly unforeseen event, then the premium option can be exercised.
But the average model does provide guidance to the fund’s most important month to month role of managing the investment portfolio. As described in prior posts, the NCUSIF investment committee seems oblivious to the current period of historically low interest rates.
As recently as August during the increased market worry about inflation and rising rates, the investment committee acted by rote. It laddered out $1.2 billion (6.2% of the fund) at an average weighted life and yield of 5.7 years and .943% . One seven-year investment decision alone cost credit unions $42 million in lost revenue because of the committee’s timing.
This is not the first time the committee has made similar decisions seemingly oblivious of the historically low interest rate period the economy is passing through.
These kinds of investment decisions, the continual piling on of expenses, and significantly erroneous estimates of loss are all examples of inadequate management. No fund design can overcome human folly.
A Dynamic Model to Follow performance
Even with a 1.22% yield in 2021, the financial reports through September suggest the fund will in fact have positive net income and grow the equity ratio. Why? There is minimal loss reserve expense and net recoveries from prior loss reserves, a lower cost of operations, and a decline in insured share growth from 2020.
A simple spread sheet model can track all these variables in real time. The spread sheet accessed here uses the September numbers for the NCUSIF and insured share growth. It projects a year end equity ratio of 28.19 which with the yearend 1% deposit true up equals an NOL of 1.2819%.
So even in an historically low yielding and poorly managed investment portfolio, the fund’s result is within the designed outcome.
Even Better News
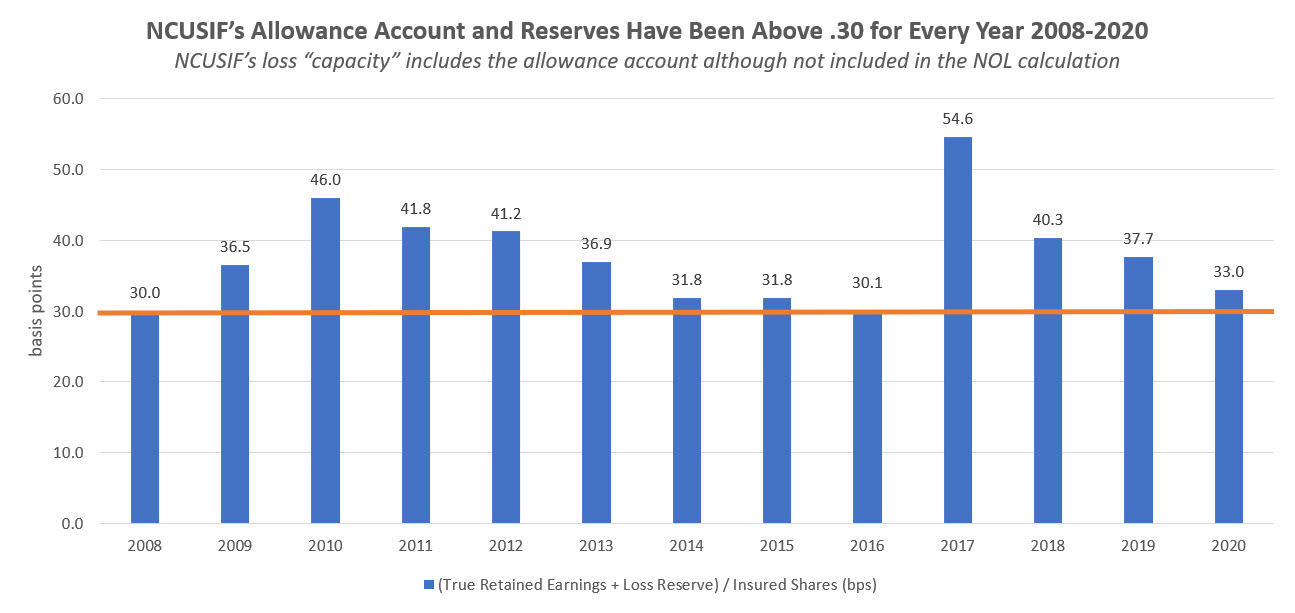
Traditionally the fund’s equity has not included the loss reserve which has been expensed from earnings but not used. When this reserve is added to the yearend actual equity ratio, then the NCUSIF reserves are even stronger, always exceeding .30, sometimes by as much as 10-20 basis points higher.
The Better Way design works, not because it is perfect, but because it is flexible and aligns resources with insured risk through constant 1% deposit required from credit unions. It tales prudent management of expenses, careful loss control and conscientious investment management.
To continue NCUSIF’s performance pattern, four steps should be taken:
- Audit and present the fund’s financial position following private GAAP accounting standards. Reset the NOL cap to 1.3% and follow accounting practice used prior to the 2001 change in recognizing the 1% deposit true up.
- Reduce the OTR to 50% to correspond to the percentage of state-insured shares in the fund.
- Update the oversight and transparency of the NCUSIF investments.
- Continue to minimize losses to the fund by working through problem cases not cashing out losses problems by sales to outside bidders.