A Disturbing Slide in May’s NCUA Board Meeting

If the CFO came to your May board  with a forecast that the credit union’s retained earnings margin would fall by 50% in the first six months of this year, it would get your attention.

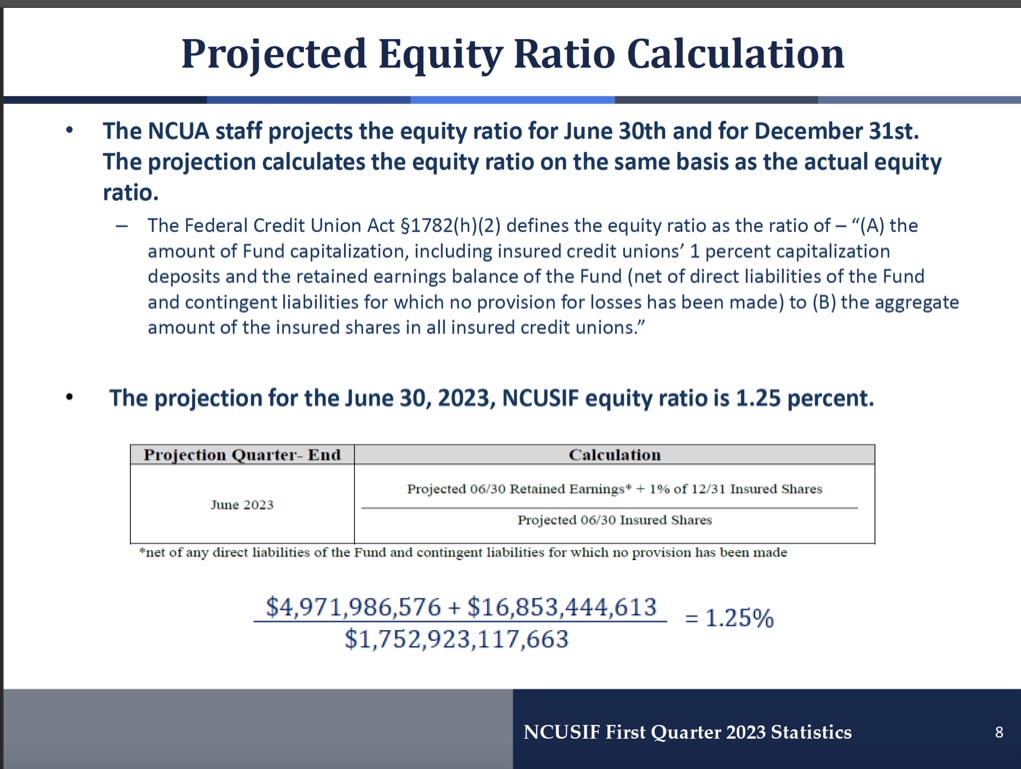
That is what CFO Schied presented in the slide below showing a decline in the NOL from December’s 1.3% to 1.25% by the end of this June.  That would be halfway to the 1.20 NOL floor at which the NCUA must come up with a restoration plan.

As summarized in my earlier report, all of the actual credit union CAMELS data, the NCUSIF financial position and other accompanying information was good news.  Especially in the context of the first quarter banking failures and the continuing risk in interest rates.

Board members acknowledged the actual resilience of the cooperative system but then picked up the forecasted alarm.

Chairman Harper suggested the actual data was just “the calm before the storm.”

Vice Chair Hauptman opened his comments stating his objective was to protect “the taxpayers” from NCUSIF failure.

Only board member Hood attempted to get behind the numbers.  He asked how the $12 million  loss reserves expense was determined and the status of proper presentation of the 1% true up.  The answers were a polite stonewall.

Similar to a credit union’s net worth, the NCUSIF’s reserve ratio is an easy shorthand for its financial position.  The calculation is straight forward.   The ratio is simply retained earnings divided by the insured shares at the same date.

This ratio was 29.1 basis points or .291% of insured shares at December 2022.  As of March 2023 the ratio was 28.8 basis points. This .3 of one basis point minimal decline in the first 90 days is a far cry from the 5 basis points projected above.

The projected ratio in slide 8 is a made-up number. Its relevance depends on the assumptions used.  The estimated growth of insured shares to $1.75 trillion is a 7.2% twelve month increase from 2022.  The actual rate of increase as of March 2023 from the year earlier was 2.2%.

The addition to retained earnings for the quarter ending June is just $6 million versus a net income of $41.7 million in the NCUSIF’s just reported March quarter.

The final number in the numerator is the 1% deposit.  The calculation above reverts back to the six-month-old December 31, 2022 total deposits. By using this out-of-date number this invented ratio understates the actual 1% deposit total due from credit unions.  Including this six-month-old deposit liability misstates  the actual ratio and cash due.

The slide’s 1.25%  manufactured outcome became the lead in several press reports. It misinforms about the trend in the NCUSIF’s financial position. The ratio’s assumptions were not explained even though they were significantly different from actual trends through March.

Monitoring an accurate Fund equity ratio matters.

Per stature, the actual NOL is calculated at yearend to determine whether a dividend must be paid should the fund’s reserves exceed the NOL cap. The number is also the floor from which a potential premium could be assessed to increase the NOL to a maximum of 1.3% of insured shares.  Getting this NOL right is vital for every credit union.

More critically the use of a number from an earlier accounting period to compare with a current period’s insured risk total does not align with standard GAAP accounting practice.

Two Accounting Examples

There are direct accounting precedents with GAAP for how the 1% true up should be reported.  They show that the concurrent presentation of insured risk and the legally required true up of the capital deposit base is standard industry practice.

The first example is Deloitt & Touche’s audit of  ASI’s required deposit an identical structure to the NCUSIF.  From the December 2022 ASI audited financials:

In our opinion, the accompanying financial statements present fairly, in all material respects, the financial position of the Company as of

December 31, 2022 and 2021, and the results of its operations and its cash flows for the years then ended in accordance with accounting principles generally accepted in the United States of America.   Deloitte & Touche, LLP April 11, 2023

And regarding the deposit requirement:

Participants’ capital contributions that are receivable or payable as of December 31, 2022 and 2021, are presented on a gross basis in the accompanying consolidated financial statements. Included in participants’ equity at December 31, 2022, is a receivable for capital contributions of Primary-insureds of $2,530,000 (no payable). The receivable and payable balances result from annual growth or shrinkage in participating credit union shares and the receivables were substantially collected subsequent to December 31, 2022.

Included in participants’ equity at December31, 2021, is a receivable for net capital contributions of Primary-insureds of $25,200,000. The receivable and payable balances result from annual growth or shrinkage in participating credit union shares and the receivables were substantially collected subsequent to December 31, 2021.  (page 13, Notes to the Consolidated Financial Statements)

The second example is the recognition in the NCUA’s Operating Fund of an “account receivable,” on the balance sheet and the income statement in its monthly statements postings.

From the January 30, 2023 NCUA Operating Funds monthly financial statements:

The cash position is considered sufficient to cover current and future budgetary obligations of the Fund through April 2023, at which time the Fund will collect the 2023 operating fees from its credit union members. . . Operating fee revenue reflects one twelfth of the 2023 Operating Fees.

A longer explanation of this accounting presentation for the expense receivable in the January 2022 statement:

Other accounts receivable, net had a month-end balance of approximately $10.5 million. Its balance increased by approximately $10.2 million from prior month primarily due to the unbilled receivable for the 2022 Operating Fee. The Operating Fee will be invoiced in March and collected in April.

In other words the Operating Fund recognizes a net receivable and records one twelfth of the total operating fee as income each month even though the fee is not invoiced till March and collected in April.

In these instances the amounts legally due are presented as receivables in ASI and NCUA’s    respective audited financial statements and monthly financial presentations.

The 1% True Up Topic Raised Again

Board member Hood asked again about the status of the external assessment of accounting options the NCUA board requested in 2021. CFO’s Schied characterized this external memo saying:  “Each option was “non-optimal.”  An unusual accounting conclusion.

NCUA has refused to publicly release this expert review under FOIA.  What options were reviewed, what data or precedents referenced, and how were the pros and cons presented?

The current practice leads users of the information astray. It potentially shortchanges credit unions’ dividends. NCUA self-interest is keeping the status quo.  The memo should be published for all to evaluate.

The credibility of NCA’s oversight of the insurance fund is a function of the legitimacy of the numbers and explanations it provides. If NCUA is not able to present the Fund’s position accurately, at a minimum it leads to misleading conversations.

How an Inaccurate Number Distorts Discussion

The fabricated 1.25 NOL ratio forecast as of the end of next month led to several illusory discussions and unfortunate public headlines.

One board member commented how the Fund’s “margin was narrowing” before “taxpayers will have to pay.”  That unfortunate characterization shows the importance of knowing real numbers.  In the first 90 days of 2023 the ratio had changed by just .03 of one basis point.

Moreover the only “taxpayers” who are legally bound to support the NCUSIF are members of credit unions. Each sends 1 cent of every savings dollar in their credit union’s 1% deposit in the Fund.

The board member’s observation that “there is not a lot of room between 1.2 to 1.3 equity” unfortunately mischaracterizes the fund’s actual operating performance since 1984.  The long term insured loss rate for the fund is just over 1 basis point.   Even in the 2008-2010 the net cash losses from natural person credit unions were 3.5, 2.0 and 3.0 basis points of insured shares.  The highest cash losses in the three years was $228 million, nowhere close to the “billions” response in the meeting.

In the most recent four years (2019- 2022) which includes the Covid crisis, the economy’s total shutdown and a rising rate cycle, the highest loss from “old school failures” was .3 of one basis point.  In 2021 the Fund reported actual net cash recoveries.

An accurate presentation of past and current NCUSIF performance is important in understanding the unique design and resilience of the NCUSIF.  Because of this collaborative resource, the credit union cooperative system is much more stable than FDIC insured bank premiums.

The Fund’s relative size to insured risks remains stable in all circumstances.   The 10 basis point guardrails (the 1.20-1.30 operating ratio range) today equates to almost $1.8 billion. For comparison, the NCUSIF’s entire total insured losses from 2008 through 2022 were $1.9 billion.   The operating expenses in this same period were over $2.4 billion.

The legislative guardrails were put in for a reason.  Credit unions feared that open ended funding would just lead to unchecked spending by NCUA.  This is what has occurred through increasing the Overhead Transfer Rate allocation to shore up the agency’s ever increasing budgets.

Constantly rising expenses, not insured losses, are the Fund’s largest drain on reserves.

Everyone Can Project NCUSIF Yearend Outcome

Forecasting the NCUSIF’s yearend NOL ratio is simple.  Here is the link to a spreadsheet anyone can use. If any difficulty using, please email.

The inputs are portfolio yield, share growth, NCUSIF net income, insured loss and whatever assumptions a user believes are consistent with present trends.  The current numbers include the latest actual NCUSIF updates through March 2023. It projects a yearend NOL of 1.2917.

Tomorrow I will review one other slide that is vital to understanding the Fund’s management.

Today’s NCUA Board Meeting: an Opportunity for Insight into the NCUSIF

With only one agenda item, the NCUSIF’s March quarterly update, today’s NCUA board meeting presents an in-depth learning opportunity about the fund’s management.

With almost $22 billion in assets, the NCUSIF is the largest investment under NCUA’s control.

Because NCUA publishes monthly updates on its three major funds, credit unions are able to monitor how their members’ funds are being used.

The public board discussion is a vital part of this process for credit unions and board oversight.

What I Am Listening For

  1. There is much confusion caused by the NCUSIF’s use of Federal GAAP versus private GAAP accounting, the standard credit unions must follow. The Federal accounting terms, presentation and practice are different from private GAAP.

This is because Federal GAAP was intended for use by entities which rely on government appropriations.

Some examples.  Cumulative results of operations: Following SFFAS No 7 the NCUSIF recognizes interest on investments as “non-exchange revenue” which in turn means unrealized holding gains and losses are reported as part of revenue.

In contrast, credit union “available for sale” securities are reported at book value with unrealized gains or losses recorded in a valuation account, not as an income or expense.  This  account is not included when computing the net worth ratio.

Credit unions report retained earnings.  Federal accounting has no comparable account. This and other differences mean that NCUA staff transform NCUSIF Federal presentation into a private format, but then do not follow private accounting practice.

For example the 1% deposit true up (or refund) is treated as revenue in the NCUSIF; however credit unions record this adjustment as an investment asset on their books.

Will this confusion be addressed?   How will this affect the calculation of the 1% true up when presenting the NOL ratio for the fund?  Private GAAP recognizes the true up as a receivable or payable on the insurer’s books when the insured risk is reported triggering the required deposit adjustments.

  1. How has the NCUSIF investment committee responded to the rising interest rate environment? The market value of the NCUSIF’s investments may have fallen by as much as $1.5 billion from the peak in 2021.   What changes have been made in response?  How will the below market income stream from the fixed rate, lower earning. long-term bonds, affect the income of the fund and projections of the NOL in 2022?
  2. Credit union’s first quarter results have been summarized in Callahan’s Trendwatch. How does the first quarter’s 9.3% actual share growth compare with NCUA’s projections for the year? What impact, if any, will the rise in interest rates have on CAMELS ratings?
  3. What changes in NCUSIF investment policy and accounting presentation/practice is staff proposing? Or will be requested by the board?

Over the past 16 months, I have written several blogs about NCUSIF investing and accounting anomalies.   Here are selected observations and additional background for the questions that may be raised in today’s meeting:

I’ll follow up next week on the board’s dialogue.  Hopefully this will be a fresh start for improving the fund’s financial practices.


A Critical CEO Change

Today American Share Insurance (ASI) announced that Theresa Mason will be the new President and CEO.  She succeeds the retiring Dennis Adams who has served in that capacity for over three decades.

According to the release:

“Theresa is a highly accomplished Executive within the Insurance industry, having spent the past 16 years in the Columbus Market with Grange Insurance and the Kansas City Life Insurance Company where she served as President of Grange Life Insurance and directed highly effective finance, operations, sales andIT teams.

A Certified Public Accountant that began her career with Ernst & Young in Cleveland, Theresa also carries her CGMA (Chartered Global Management Accountant) and holds affiliations with theAmerican Institute of Certified Public Accountants (AICPA) and the Ohio Society of CPA’s.”

Why This Matters

In ten states ASI is the share insurance option for state chartered credit unions instead of NCUSIF.

Today state charters hold approximately 50% of all credit union assets. The choice of share insurance is critical to a viable dual chartering system.  It allows state chartering authority to be the primary regulator.   Credit unions are closer to the legislatures and policy makers who create the laws governing their actions.

As a result, state charters have traditionally been the incubators of change for the entire credit union system.

In his final Annual Report message outgoing CEO Adams stated:

Without the option of private share insurance, I can attest that there are credit unions in America that would not be operating today. ASI has never been simply another vendor. To the contrary, we have always promoted our core value proposition as a true business partner to all of our member/owner credit unions, and our commitment to that has worked, and worked successfully, and that will never change. 

ASI’s board of directors is composed of credit unions and outside professionals elected by the credit union members.

ASI’s annual report shows the total primary insured shares of $20.4 billion with the program available in ten states.  It has received an outside audit by Deloitte and Touche and unqualified opinion following GAAP accounting standards.

The NCUSIF is A Better Way– IF Properly Managed

The NCUSIF’s redesign culminating in the October 1984 NCUA board implementation was revolutionary.   This two-minute excerpt is from NCUA’s Video Network of that historical vote:

NCUA Bd Mtg Approves NCUSIF Redesign: A Better Way .

A Partnership

Board member PA Mack summarizes his approval saying:   I’m ready to support this and think it is an outstanding product as a partnership among government and credit unions.”

NCUA wanted credit unions as partners, with mutual give and take, and together the cooperative system created the most successful federal insurance program ever. 

Can Work Beautifully

When approved by a 3-0 vote, Chairman Ed Callahan congratulated everyone for their efforts and commented:  “This is a very significant thing for credit unions.  This system can work beautifully for credit unions in the future. I think the real challenge goes to you people in NCUA now.  The real secret is in the operations.” 

Callahan believed the power of NCSIF’s redesign was that it clearly invites credit unions into “cooperation” now and as long as the system’s integrity is preserved though proper management.

A Three-Year Process

This redesign did not happen overnight.  It emerged due to the failure of the premium based approach modeled after the FDIC and FSLIC funds founded four decades earlier.  This reassessment was documented in a 120 page report NCUA sent to Congress in April 1983. It featured  comments from all segments of the credit union system. Legislation was drafted with credit unions and sent to Congress in 1984.

NCUA actively encouraged credit unions to support the legislative change.  An NCUA video outlined the plan including the NCUSIF’s financial history since 1971-1984.  This analysis was the foundation for creating A Better Way.

In the 1985, NCUA reported the outcome for credit unions following the first year of this new design:

Dividend of 5%: Because of the fund’s performance . . . for the first time ever the NCUSIF paid a dividend which represents about $30 million in equity distribution. . . The NCUSIF has returned in some form almost $270 million to credit unions: the $84 million equity distribution (when calculating the 1% deposit), the insurance premium waiver for last year, the $30 million dividend and leading into the next year, a $90 million premium waiver.  (Source:  Page 5 NCUSIF 1985 Annual Report)

The partnership approach based on transparent communication with credit unions and immediate return created another system benefit. The radical restructuring proved to be the way to something more– an action  that renewed the entire system’s hope during deregulation and that credit unions still benefit from  today.

The Operations of the Fund

The critical aspect of the NCUSIF’s cooperative design, as noted by Chairman Callahan, is how he fund is managed by NCUA staff.  These four primary responsibilities include:

  • The regular, timely and accurate reporting of the fund’s financial position.
  • Prudent oversight of  NCUA’s operating expenses charged to the fund.
  • The careful management of fund losses to ensure the least possible cost resolution for problems.
  • Intelligent and professional management of the fund’s primary revenue source- the yield on its investment portfolio.

In the aftermath of the 2008-2009 financial crisis a material change occurred in NCUA’s management of each of these responsibilities—all contributing to an increasingly confusing and misleading presentation of the fund’s financial status.

Today I will focus on the 2010 change from private GAAP accounting to Federal GAAP. Future posts will discuss the remaining three responsibilities.

The Ill-suited Change to Federal GAAP Presentation

From 1982 through 2009, the NCUSIF financials were audited and presented following private GAAP accounting standards.  This was a critical part of the NCUA commitment to follow the same reporting and presentation standards it required credit unions to implement.

Credit unions had agreed to the perpetual 1% underwriting of their NCUSIF deposit. In return the NCUA guaranteed the information to properly monitor the agency’s management of these ever- growing 1% deposit assets.

This private accounting standards in 1982 was a departure from the NCUA’s initial practice of relying on a GAO audit which was often late in completion and did not follow GAAP accounting practices.

Why Reliance on Federal GAAP is Inappropriate and Misleads Credit Union Owners and the General Public.

Federal GAAP reporting was intended for use by entities that receive appropriations from the government.   The NCUSIF receives no government funding.  The  unique cooperatively designed fund relies on withdraw-able member deposits as the principal underwriting  source, not an insurance premium expense levied on credit unions.

In Federal presentation the normal balance sheet categories are divided into Intra-governmental accounts and Public accounts, a confusing description at best.  Liabilities have the same misleading divisions.  The Net Position contains a federally  defined Cumulative Results of Operations, sometimes mischaracterized  as retained earnings.  However in federal GAAP this account includes changes in the net unrealized gains and losses on the NCUSIF’s investment portfolio during the year.

Private GAAP does not include this.  As a result the monthly income and yearly audited statements present a completely misleading number from a retained earnings or equity perspective.

The traditional income and expense information is  renamed as Statement of Net Cost.” This presentation is similarly as confusing and misleading as the balance sheet categories. The presentation begins with Gross Costs , followed by Less Exchange Revenues, with a so called bottom line labelled,  Net Cost of Operations.

In 2020, Federal GAAP reported an NCUSIF  bottom line of a $239 million gain; however private GAAP net income was only $32.9 million.  The outcome is that actual retained earnings do not correspond to cumulative results of operations, thus misstating the true NOL when the 1% deposits are added. This annual over or under presentation of “fund equity ” is shown in the following chart.

Federal government accounting  reporting does not appropriately present the fund’s “equity” at yearend

This confusing presentation continues in the other required financial statements. These include the federally prescribed Changes in Net Position and the Statements of Budgetary Resources.   Neither portrays the data needed to understand traditional financial concepts of changes in cash flows, retained earnings or total equity.  These concepts were created for federally appropriated entities.

To see the full 2020 audit report following Federal GAAP presentation, click here.  Pages 13 and 14 are completely unintelligible versus private GAAP presentation.

The standard Federal GAAP presentation is so confusing that when staff updates the NCUSIF financial results to the board, the income statement and balance sheet are converted  to the standard GAAP income and balance sheet formats.

However even this monthly “translated” accounting practice is a mash up of private and federal GAAP concepts.  For example the most recent NCUSIF update showed  a quarterly net income at September 30 of $58.6 million.  The balance sheet account which would include this gain is called the Cumulative Results of Operations.  That account instead shows a quarterly  “loss” for the September quarter of $16 million.   This $75 million total difference is due to the net decline in market valuation of the investment portfolio.

Two Different NOL Calculations in the Audit

These distortions continue even when NCUA calculates the formal audited NOL ratio at yearend.  In the 2020 audit footnote 13  states the NOL is 1.26%.  This number is calculated by dividing the total Net Position of $18.9 billion by yearend insured shares of $1.5 trillion.

However in the same audited statement NCUA presents a different way to calculate the NOL and whether a dividend is due credit unions:

The NCUSIF equity ratio is calculated as the ratio of contributed capital plus cumulative results of operations, excluding the net cumulative unrealized gains and losses on investments, to the aggregate amount of the insured shares of all insured credit unions.  (pg 134 NCUA annual audit for NCUSIF, emphasis added)

Subtracting the net gain of $511 million NCUSIF net investments  at 12/20 from cumulative results of operations gives and NOL, per the above paragraph,  of 1.228 or 1.23%.   Which number are credit unions to believe?  Which NOL calculation determines the dividend?

Why Readopting Private GAAP is Critical

The confusions and misleading calculations shown above are just some of deviations from private GAAP accounting financial presentation and audit scope.

Moreover the misrepresentation even extends to how the 1% required credit union deposit true-up is included in the yearend NOL calculation.

The recognition of the 1% required capital true up was a settled financial practice until the board chose to change this in 2001.  Today that change continues to distort the true NOL.

For example the traditional method for NOL calculation followed from 1984 through 2000 would result in an NOL of 1.32% at 2020 yearend. ( a retained earnings ratio of .32 plus 1%) This is much higher than either of NCUA’s two reported calculation methods in the NCUSIF audit.

This underreporting misrepresents the NCUSIF’s actual financial strength and would deny credit unions a dividend if the historical NOL cap of 1.3% had been in place.

For users of the NCUSIF financial statements, Federal GAAP is confusing and misleading.  The NCUA in fact continues to use private GAAP in all three of its other fund annual audits and monthly presentations.

“Fairly presenting” the NCUSIF results for credit unions requires a return to an accounting system which credit unions can understand so they  can monitor their investment in the fund.

Tomorrow I will look at how NCUA has changed the way it charges the NCUSIF for its operating expenses.  And the consequences on the fund’s financial performance.


GAO’s NCUSIF Study Omits the Most Important Data Point

The GAO  released a report in October analyzing the causes of credit union failures from 2010-2020.   The news stories and report lead with two facts:  145 credit unions caused $1.55 billion in losses to the NCUSIF in these eleven years.

The full report  took 16 months to complete and contains appendices full  of math correlations and sophisticated looking analysis.

However it omits the most important fact about these losses.  That is the NCUSIF’s 1.30 Normal Operating Level (NOL) is 93 times larger than the rate of insured losses for this period.  That is a critical actuarial finding.

The GAO failed to put its analysis in any context or perspective.  Any loss is too much.  All credit unions operate in a competitive market.  As noted by Ed Callahan when Chair of NCUA discussing deregulation, “Some credit unions will do better than others.”

The most important issue is the financial impact of losses on the NCUSIF and credit unions.   Using the GAO’s $1.55 bn total, this results in a loss rate on insured savings in this eleven-year period of 1.4 basis points.

The loss  trend is also declining as noted in the study.  Of this total, the report (page 13) says $831.7 million was from the failure of three taxi medallion credit unions in 2018.   That means the 142 remaining credit unions lost $718 million for a loss rate of only .65 of 1 basis point.

In the context of a $20 billion insured fund with total capital equal to 1.3% of insured savings, the fund is 200 times larger than the insured losses if the disruptive event of the taxi medallions is not included.  If counted, the fund as noted, is 93 times larger than the eleven-year  insured loss rate.

Reasons for Failures

Figure 7 on page 19 is a table labelled: Top Material Loss Review Causes or Contributors to Failure by Number of Times Mentioned.

This is the list of the six causes from most to less frequently cited:

  1. Credit Union Board or Committee Oversight
  2. Failure by NCUA examiners
  3. Weak or missing NCUA Guidance
  4. Fraud
  5. Management integrity
  6. Lack of timely and aggressive NCUA action

All of these six areas are why there is an examination of every insured credit union.  These “causes of failure” should be covered in every exam.

The report does not cite economic circumstances or external disruptive events, as in the taxi medallion credit unions, as reasons for losses.  The report began after the Great Recession with losses in 2010 when the economic recovery was well underway.

What the report makes clear is that NCUA’s exam program has much room for improvement.

At yesterday’s November board meeting, the CFO commented that the positive NCUSIF AME recoveries from prior loss estimates has continued into November.   So the net loss reserving expense for 2021 is, in effect, negative.   This means the two most recent NCUSIF loss ratios cited above should be even lower when this year’s results are added to this study’s total.


NCUSIF Investment Decisions Are Hurting Credit Unions

Several days ago, NCUA posted the August financial results for the NCUSIF.

The good news is that the fund continues to show positive net income.  For the first 8 months the year-to-date net is $122.2 million versus $45.4 for 2020.

However, only 13% of the fund’s $19.2 billion portfolio matures in less than one year.

In contrast, at June 30 credit unions reported 53% of their total investments were under one year.  Of that amount over half, or 38% of all investments were in cash and overnights.

Both credit unions and NCUA have access to the same economic forecasts.   Why is there such a dramatic difference in how investments are being positioned in this part of the rate cycle?

At the September board meeting CFO Schied promised to publish the NCUSIF’s investment policy in response to a question from a board member.   The $1.2 billion reported in new August investments shows why this transparency is so urgent.

The most important monthly  decisions by the fund are selecting investment maturities.   The board and credit unions should know  the assumptions committee members used when making these decisions.

The NCUSIF’s August Investments

As listed in the NCUSIF financial report:

8/16/21 T – Note 600,000,000 $ 8/15/2028 1.01%

8/26/21 T – Note 100,000,000 $ 8/15/2026 0.84%

8/26/21 T – Note 100,000,000 $ 8/15/2027 0.97%

8/26/21 T – Note 100,000,000 $ 8/15/2028 1.11%

8/26/21 T – Note 100,000,000 $ 8/15/2025 0.66%

8/26/21 T – Note 100,000,000 $ 8/15/2023 0.22%

8/26/21 T – Note 100,000,000 $ 8/15/2024 0.45%

I calculate an average weighted life of 5.7 years and a portfolio yield at .943% for these seven investments.

The critical question is what were the committee’s assumptions that caused them to lock up $1.2 billion for 5.7 years at a yield under 1%.  These actions also reduced the overnight account of over $1.0 billion in June to just $230 million in August.   It lengthened the portfolio’s average maturity by over 100 days.

The decisions show a seeming absence of any market awareness. Two investments have the same seven-year final maturity.  However between the August 16, $600 million first note purchase, and the August 26 $100 million second note at exactly the same maturity, the yield rose 10 basis points!

This 10 basis point lower yield on the first $600 million will cost the fund and credit unions $600,000 per year for seven years, or a total of $4.2 million over the life of the note.  How did the committee make such an obviously untimely decision?  Why has the committee continued to invest further out the yield curve when the consensus of most economists is that rates will be rising?

Shouldn’t the fund instead be rolling over these  notes in 13 week, 6 month or one year Treasury bills yielding .05% to .15% in order to reinvest these funds as the markets move? For example the two year treasury bill has more than doubled in yield from the .22% return NCUA received in August.

I know of no credit union that would have made these investments with this average maturity and this yield with member funds.   But that is what the committee did.

At the markets close today, the seven-year treasury note yielded 1.414% and has traded as high as 1.5%.

If the $600 million had yielded 50 basis points higher, this would generate $21.0 million over next seven years for the NCUSIF.

Going Forward

For the quarter the major topic on the economy has been inflation.   Is it transient due to temporary structural issues or shooting way beyond the Fed’s 2% target?

The economy’s continued supply shortages are now estimated to extend into mid 2022.  Today  the Fed will release its interest rate and monetary policy steps going forward.   The tapering of bond purchases is expected and many forecasters foresee a Fed rate increase sometime in 2022.

Unfortunately recent NCUSIF investments will be a drag on its revenue for years to come.   Continuing to invest in a period of historically low interest rates using the same ladder approach as in years of more normal rates makes no sense.  These unusual investment decisions hurt credit unions and their members by causing revenue shortfalls for the fund.

The NCUSIF’s incremental investments should instead be rolled over in very short maturities and then re-invested as rates move into ranges consistent with the yield requirements for the NCUSIF’s operations.

The investment committee is presumably the same senior NCUA officials who oversee examination and supervision priorities.  What would their response be to a credit union making these investment decisions?

Timely and transparent presentations of the cooperatively-owned NCUSIF financials is a commitment made by the agency when the 1% underwriting deposit was implemented.   Fund results should be posted as soon as they are ready.

There needs to be a discussion in the published report of the investment actions, or none, made during the month.  That is one critical way to build confidence in the management of this unique credit union resource.   And to insure decisions are made in credit union members’ best interests.


“The Best Damned System in the Country”

NASCUS members’ Annual State Summit meeting  begins today.  It includes a “fireside” chat with new NCUA Chair Harper.  Hopefully this dialogue will be enlightening.  For two of his recent proposals pose an existential threat to the dual chartering system.

The first would fundamentally alter the legal framework of the unique, cooperatively designed NCUSIF, by removing all the guardrails on expenditure.  Harper defends these changes by reference to the FDIC, a premium based fund that has failed repeatedly since the NCUSIF 1984 redesign.

The second Harper initiative is a new three-pronged capital structure for all NCUSIF insured credit unions.  Some credit unions would be allowed to follow the current risk based net worth (RBNW) model. Others would be required to follow the 2015 risk based capital (RBC) rule, yet to be implemented.  A third group of so-called complex credit unions could elect a new CCULR ratio that would raise their well-capitalized requirement by 43% from the current 7% to 10%.

All of these capital changes would take effect on January 1, 2022, or in five months, if Harper is able to get a second board vote.

The End of Dual Chartering

Aside from the lack of any substantive basis for these proposals, the outcome would effectively end the dual chartering system.   Risk based capital would throw a single regulatory blanket over every asset and liability decision made by an NCUSIF insured credit union.

NCUA would be the single hegemonic regulator for all coop charters. This single lens for risk evaluation would create a homogenous cooperative balance sheet.  Instead of increasing safety and soundness, if this uniform approach to risk analysis is wrong, it could lead the cooperative system over a cliff.

The One Sure Defense: Choice

This prospect of NCUA dominance was foreseen decades ago.   The following is a timely and timeless reminder of this threat in a speech by former NCUA Chair Ed Callahan in 1986.   The excerpt of these remarks to the Association of Credit Union League Executives is under three minutes. https://www.youtube.com/watch?v=cTMGvXPnVa8

“The insurer is the regulator.  The system only works when there are choices.”

When Leaders Lack Confidence in their Organization

What would you think if you learned that Warren Buffet was shorting Berkshire stock? Or Elon Musk prefers driving a Lexus?  Or Jeff Bezos doesn’t want to test fly his Blue Origin Space capsule?

None of these situations is true.  And because the opposite is the case, observers’ trust in these leaders and their organizations is sustained.

A Credit Union Example

Seven years ago, in October 2015, NCUA over the objection of board member Mark McWatters, approved a final 424-page RBC rule. This was NCUA’s second attempt to impose this new reg which was as equally unsupportable as the first.  Both attempts were universally opposed by credit unions.

One of the rationales for the rule stated in the 2014 NCUA Annual Report was “the issuance in 2013 of new risk-based capital rules by the FDIC, the office of the Comptroller of the Currency and the Board of Governors of the Federal Reserve System.” (page 12)

Certainly, an impressive endorsement by banking regulators.  However, in September 2019 the FDIC with the full concurrence of the Comptroller and Federal Reserve removed RBC requirements for all community banks under $10 billion.  Did NCUA follow its peer’s decision? No, It plodded on, kicking the can down the road even though one of their primary justifications was gone.

What the Rule Says About NCUA’s Self Confidence

But there is another insight, besides bureaucratic obstinacy, to take from the final proposal.

The agency published a two-page summary — Risk Weights At a Glance –as the final summary of absolute and relative risk of every possible balance sheet asset. Three judgments are illuminating.

Credit unions investing in the capital of the CLF have 0 risk.  Since the CLF has not made a loan for over a decade, it suggests how the agency is thinking about the CLF’s role assisting credit unions in the future.

The FHLB’s do make loans to credit unions. To qualify for these, a credit union must buy stock in the bank. NCUA determined these stock purchases should be assigned a 20% risk weighting.

Even though no FHLB organization has ever failed, the agency believes there is still a small risk.  But it is nowhere near the risk of a credit union investing in a CUSO, which requires a 100-150% weighting.

But the most ominous risk is for credit unions’ 1% capital deposit in the NCUSIF.  According to the chart, the 1% deposit cannot even be counted as an asset.  It must be subtracted in full from the numerator of the credit union’s net worth and from the denominator’s total of all risk weighted assets.

It is counted as having no value despite having been untouched for almost 40 years.  It is an earning asset, withdrawable in a voluntary liquidation or conversion to private insurance. On both credit union and NCUSIF balance sheets it is carried at full value.  Multiple national accounting firms have stated this asset “fairly presents” both aspects of this transaction.

What would subtracting this asset mean for the NCUSIF’s Risk Based Capital ratio!  If credit unions cannot count this as an asset, how can NCUA include these deposits in the NCUSIF’s net worth?

One interpretation is that this is just one of many foolish aspects of the final RBC rule which becomes effective January 1, 2022. But there may be more intention than one might think.

A Scary Thought

This NCUSIF total write-off of the 1%  from net worth, like the hypothetical made up examples first above , points to an uncomfortable reality.  This is an agency whose leaders lack confidence when managing the ever growing resources credit unions provide.  And if they lack the understanding of this cooperative fund’s operations, what message is sent to credit union members?

Today the NCUSIF equity level above the 1% deposit totals over $4.7 billion.  Should a loss of that magnitude or more occur, the primary question will not be about the status of the 1% deposit, but where was the regulator?

The cumulative loss rate for he NCUSIF over the past 12 years and two financial crises, is 1.5 basis points.  To project a loss at least 20 times this recent real world experience, is deeply troubling. (2,000 percent, i.e. 30/1.5)

That potential accountability is why the agency wants to eliminate the 1% from credit unions’ net worth today.  NCUA wants to avoid explaining how its oversight allowed such a situation to develop.

Now that is a scary thought.


The NCUSIF Tool Every Credit Union and NCUA Should Use

The cooperatively created NCUSIF is an insurance resource designed for all economic seasons.  Whether there are clear financial skies, clouds or even once-in-a-hundred years storm (e.g. the COVID economic shutdown in the 2nd quarter 2020) the structure is flexible, transparent and proven.

Most importantly, its current performance is easy to monitor, by anyone.  It does not require a PhD in economics, 20 years of regulatory experience or even the expertise of a Black Rock.

There are only four moving parts.  There are 36 years of actual data to call upon.  Each component has historical and contemporary data to employ in the model.

The model’s four variables are:

  1. The operating expenses taken off the top from NCUSIF income through NCUA’s OTR process;
  2. Insured losses–there is data for all economic cycles. In the past 13 years and two crises, the cumulative rate is loss rate is 1.51 basis point for each $1 of insured savings.
  3. The yield on NCUSIF’s portfolio reflects the staff’s investment decisions, and is semi-fixed in the short term due to its current weighted average life of over three years.
  4. Credit union insured share growth. It is reported quarterly.  The most recent 13 year CAGR is 7% even including 2020’s unusual rate of 22%.

The Model Demonstrates A Better Way

In 1984 credit unions and NCUA worked together to create a cooperative fund that would be A Better Way than the failing premium-based systems. This dynamic model shows how this financial design works and more importantly how it can be even better managed today.

The model has two key capabilities.  It dynamically links the four financial variables so that any input change automatically recomputes all outcomes.

Second it translates the variable input measures into understandable, actionable data.  Converting historical insured loss experience (bps), rates of share growth and investment yields(%), and operating expense ($) into one integrated financial design ensures the model always aligns with the size of insured risk.  For example 1 basis point loss in 2010 is $76 million; however in 2020, that same loss rate is $144.5 million due to the growth of insured shares. The model’s output is provided in all three measures: $, % yields, and basis points to easily understand the options for the yearend NOL.

Events have demonstrated that NCUA’s NCUSIF models used in 2017 through today are not based on any objective reality.  The so called scenarios are financial myths developed to support NCUA’s desire to remove the guardrails on the most successful deposit fund ever managed by the federal government.

The Dynamic Spread Sheet

This is the link to view the xcel calculator with the numbers used below.  To enter your own numbers, feel free to make a copy (open this view-only copy with google sheets, click File, then Make a Copy).  Using your copy will automatically calculate the yearend outcome with your inputs.

Models are not answer machines. They inform judgments.  They require objective validation.  When used properly, they identify options and improve management effectiveness. The following is the example shown in the “view-only” model link above.

An Example With Actual Data

The audited yearend NCUSIF data from December 31, 2020 is entered in the view-only example. This includes the audited reserves ($4.7 Bn), insured shares ($1.467 Tr), the reserve ratio (.318) and a 2021 yearend goal for this ratio (.30).  With the 1% credit union deposit, the spread sheet calculates the performance required to reach a 1.3 NOL at 2021 yearend.

The columns E, F, G and H are four variables that can be updated anytime.  I have entered both current numbers and informed estimates.  For share growth I used the first quarter’s annual rate of 23%; for loan loss I entered .5 of a basis point which is below the long term 1.51 rate because to date, the NCUSIF has reported net recoveries.

For total investments I have added the increase in 1% deposits from the year end true up and a mid-year estimate.  However, the portfolio’s size is not increased 100%, reflecting that these additional deposits will only earn for 9 and 3 months, respectively.  The $190 million expense total is higher than 2020’s expense and uses the 2021 budget modified by actual results through May.  Finally, for the yield, I entered NCUSIF’s current year-to-date portfolio return, 1.27%.

The five green columns show the projected yearend outcome from these inputs.  The required portfolio yield is 5.28%, way above the current yield.  This shows a yearend NOL of 1.257.  To raise that outcome to the target 1.30 level would require a maximum premium of 4.33 basis points of 2021 yearend insured shares or $782 million—if nothing changes in these input assumptions.

That certainly seems a dour result in this relatively stable and growing economic climate.  It does not necessarily require a premium. At numerous points in the past when the NOL ended below the 1.3% cap, NCUA has foregone a premium at yearend, most recently in 2016 ending  with a 1.24 NOL.

A Different, More Probable 2021 Scenario

However, this forecast and assumptions are an unlikely outcome. Extraordinary share growth is driving this result.  The rate is already slowing.  June and September call reports will provide a more relevant number.

For example, if insured shares grow at the 13-year average of 7%, then the results are totally different.  The required portfolio yield would be just 1.6%, and the year-end NOL, without any premium, is 1.296, almost at the 1.30 cap.   Further, if there were no insurance losses (zero loss provision), and only continued recoveries, the yearend ratio would be 1.308, above the NOL target.

It’s Not Rocket Science

Credit union CEO’s and boards are living daily the operational experiences underlying these inputs.  They know industry growth trends, delinquencies and certainly have a feel for interest rates.  Their input assumptions can be informed by their real world understanding, not guesses about the future.

This simple model should empower every credit union to evaluate the information and NCUSIF projections used by NCUA. Responses should be formed from their expertise and data, not unsupported opinion.

But more importantly, anyone who uses it will understand the flexibility and viability of the NCUSIF’s cooperative design.

Every year the NCUSIF automatically grows at 80% of the share growth rate via the 1% deposit true-up (1/1.25).

If insurance losses, share growth or yields fall outside the long-term credit union system’s experience, then a premium is an option to maintain a targeted reserve ranging from .2 to .3.  There were many adjustments to the NCUSIF equity during the 2008-2020 period.  However, the two premiums in 2009 and 2010 averaged only 1.3 bps annually over these 13 years.

The Yield Calculator as a Management Tool

Another value of the NCUSIF model is using the Yield Calculator and the recent 13-year averages to calculate the breakeven yield on investments needed to maintain an NOL target, say 1.25, or within a narrow range.  One must first convert the operating variables to basis points. Adding the 7% insured share growth rate(1.75 basis points) plus 1.51 basis point loss experience, and the 1.6 bps of operating expenses totals 4.86 basis points.  Dividing this total by the portfolio size of 1.25  (the midpoint of the  NOL)  shows the “breakeven” investment yield needed to support this NOL is 3.9%.

The model clearly highlights the relative importance of each of the four variables.

Operating expenses come off the top of revenue. If the OTR had remained aligned with the proportion of state charters, or 50%, the operating expense share would have been 1.41 (not 1.6) basis points, thus lowering the required breakeven yield.

If share growth were 22%, not the long-term average of 7%, the bps for this variable would increase to 5.5 and the required yield jumps to 6.9%.

 Managing the NCUSIF’s Portfolio

The model demonstrates the importance of monitoring the decisions about NCUSIF’s investment  portfolio. If the current yield 1.27% and 4.86 basis point of inputs were frozen forever, credit unions might have to pay an annual premium of 3 basis points (1.27%-3.9% equals yield shortfall of 2.63%/.8/1.07 = bps premium on the new year end 1% insured share base) to maintain the NOL at a 1.25 breakeven level.

Informed oversight of the NCUSIF’s portfolio decisions is a vital responsibility of NCUA  management and board.  Market rates change. In the interest rate trough of this economic cycle, should NCUA be making 8-year fixed term investments for a 1.26% yield (April 2021) when knowing the breakeven goal for NCUSIF is  3% to 4%?

On November 18, 2018, the yield on the two-year treasury bill was 2.98%.  Today the yield is .26%.  If NCUA’s investment managers are supporting the NCUSIF’s financial model, should they be routinely  filling out an investment ladder up to 8 years in this part of the economic cycle? Common sense says no—this will reduce NCUSIF’s income, shortchanging credit unions years into the future.

The economy is at an historical low point in this interest rate cycle.  The dominant economic topic today is the inflation outlook.  Are price increases here to stay or a transitory event?  Whatever the outcome, realistic judgment suggests that rates will be higher 6-12 months from now–the only question is how much higher. An example of this change prospect  from the past ten years is that the peak in the 5-year treasury yield was 3.07% on October 1, 2018, just two and a half years ago.

Tools Are Only as Good as the User’s Skills

Every credit union uses spread sheets.  This model is a simple, automatic xcel tool-just add your own judgment.  All the variables are in the formulas.  Some inputs are set; others easy to project.

Interpreting the outcome(s) is the art.   Bias will sometimes cloud these judgments. That is why it is vital that commentators on NCUA’s request for NOL comments document opinions with factual underpinnings and an understanding of how special this coop fund is.

Good luck with the model; critiques/questions are welcome.  Tomorrow I will suggest points to make by credit unions responding to this NCUA’s NOL request.

NCUA’s NCUSIF Accounting Short-Changes Credit Unions

This is second of five articles is to assist credit unions responding to NCUA on the capital adequacy (NOL) of the NCUSIF due July 26.  The first article quoted Chairman Todd Harper’s unsubstantiated view that  NCUSIF’s structure is inadequate and requires more NCUA authority to assess premiums.

This article reviews the accounting changes, beginning in 2001, that reduced NCUSIF dividends and increased expenses. These changes have prompted some to suggest that NCUSIF’s financial design is inadequate — a mistaken judgment I will challenge.

NCUA published NCUSIF’s audited financial statements for 2008 and 2009 only after a prolonged delay. With these audits NCUA changed accounting standards creating  confusion, misleading presentations and uncertainty about what assets were audited.

The NCUSIF is unique due to its cooperatively underwritten financial structure.  To provide relevant responses to NCUA’s request requires agreement on basic facts.  NCUA’s changes  in 2000  deviated from the NCUSIF’s prior consistent accounting practices used since the 1984 redesign was approved by Congress.

These changes resulted an ever increasing draw on the NCUSIF to pay a larger proportion of NCUA’s operating expenses and underpaying dividends to the credit union owners.

Since 2008  and two financial crises, the data show that  the NCUSIF’s  operating expenses exceed  insurance losses from problem credit unions. Instead of a capital reserve helping credit unions, the NCUSIF has become the main source for financing the agency’s administration, not the required operating fee.

The following is a description of these significant changes in NCUA’s management of the NCUSIF.

Manipulation of the NOL

From 1984 though 2000, NCUA was consistent in its calculations of the NOL. Credit unions’ 1% deposit funding obligation has always been an explicit legal liability. As stated in the Act: Federally insured credit unions are required to maintain a deposit equal to one percent of their insured shares with the Insurance Fund. 12 U.S.C. 1782(c)(1)(A)(i).

In the NCUSIF’s 2000 Annual Audit, this 1% capitalization and NOL calculation are reported as follows in audit footnote 5.

“The Credit Union Membership Access Act (CUMAA) of 1998 mandated changes to the Fund’s capitalization provisions effective January 1, 2000. . . The NCUA board has determined the normal operating level to be 1.33% as of December 31, 2000 which considers an estimated $31.9 million in deposit adjustments to be billed to insured credit unions in 2001 based upon insured shares as of December 31, 2000. . . The CUMMA mandates that the use of year-end reports of insured shares in the calculation of the specified ratios, and the dividends related to 2000 will be declared and paid in 2001 based on insured shares as of December 31, 2000.”

This 1.33% ratio was calculated by dividing NCUSIF’s audited reserves plus 1% of yearend insured shares by total insured shares. This method was the basis for sending credit unions a sixth consecutive dividend from 1995 through 2000.

But in 2001, the Board changed this calculation both retroactively for 2000 and going forward in 2001 and ever after. This change is described in footnote 5 in the 2001 audit:

“The NCUA Board has determined that the normal operation level is 1.30% as of December 31, 2001 and December 31, 2000. The calculated equity ratio at December 31, 2001 was 1.25%. The equity ratio at December 31, 2000 was 1.33% which considered an estimated $31.9 million in deposit adjustments billed to insured credit unions in 2001 based upon total insured shares as of December 31, 2000. Subsequently such deposit adjustments were excluded and the calculated equity ratio at December 31, 2000 was revised to 1.30%.

However, NCUA did pay the previously calculated dividend for 2000 based on the initial 1.33% NOL. “Dividends of $99.5 million which were associated with insured shares of December 31, 2000 were declared and paid in 2001.”

If the same method of calculating equity to insured shares ratio in 2000 were applied in 2001, the resulting NOL would be 1.303%– not 1.25%– thus triggering a small dividend.

By undercounting the full 1% deposit NCUA avoided paying  a dividend. It misstated the actual NOL of 1.3% by 5 basis points, a significant reduction.

There was no basis for this change. In every year prior to 2001 NCUA sent invoices after yearend. That is the case today as NCUA bills credit unions their required true-up on insured savings after receiving the yearend call reports.   The  yearend NOL determination is easy and transparent– both the audited reserves and credit unions’ report of insured shares are available at the same time from the same source.

In making this arbitrary change to the NOL calculation, NCUA has understated the actual NOL to the present day. The underreporting of this ratio meant NCUA did not pay dividends as required (as in 2001) and understated the actual NOL ratio.

Graph Heading;  NCUA’s Reported NOL Understates NCUSIF’s Actual Capital Ratio (2008-2020)

Changing the OTR in 2000

Another NCUA draw upon the fund began at this time. In 2000 NCUA increased the percentage of its operating expenses charged to the fund via the Overhead Transfer Rate (OTR). The change from 50% to 66.7% was a 33% increase in just one year. This increase occurred  even though state chartered federally insured credit unions (FISCU’s) were only 44% of the total 10,316 of the NCUSIF’s insured base.

The agency continued to use this annual transfer in uneven and undocumented patterns reaching a peak OTR of 73.1% in 2016. This  increase reimbursement for agency expenses and understating the actual NOL resulted in no or only partial dividends due the credit union owners.  This dividend drop-off took place even though insured losses from 2001 until 2008 were either 0 or less than 1/2 of a basis point.

For example, in the 2006 audit, the NCUSIF declared an NOL of 1.304 requiring a dividend of $51.5 million. The actual ratio was 8 basis points higher and should have resulted in $103 million more paid out but which was kept in the NCUSIF.

No Timely Numbers and Changing Auditors

In the midst of the 2009 financial crisis, NCUA conserved US Central and WesCorp. Chairman Michael Fryzel asserted in a March 21, 2009 Wall Street Journal interview, “With us in control, we’d get honest numbers.”

That is exactly the opposite of how NCUA reported its own numbers for the NCUSIF. All the corporates routinely filed and published full 5310 monthly financial reports with current portfolio valuations within 30 days of every month end.  The corporates were managing over $100 billion in investments. But  NCUA did not release its December 2008 NCUSIF audit until a year and a half after yearend.

During this period of  uncertainty, NCUA took the following steps:

  • It replaced the NCUSIF’s 2008 auditor Deloitte, Touche with KPMG for 2009;
  • It changed auditing standards–from private GAAP to government GAAP;
  • It released the December 2008 audit on June 10, 2010, 15 months after the statutory April 1 deadline for reporting to Congress.

These actions typify a reporting entity with serious managerial difficulties subsequently noted by both auditors.

By delaying the release of the numbers, credit unions did not know the status of the fund. NCUA statements ranged from Chairman Fryzel’s assurance in the WS J that “regulators aren’t concerned about the health of any other wholesale credit unions besides the two brought into conservatorship” to wild exaggerations of losses that would cause write off of credit unions’ 1% deposit base.

The corporates managing the problem assets reported timely; NCUA did not.

NCUA provided few factual updates to counter the rampant hyperbole. Meanwhile the economy showed positive growth in GDP and market valuation recovery beginning in the fourth quarter of 2009.

Without NCUA’s numbers, credit unions were in the dark about how a mutual solution might be developed to minimize loss using the collaborative financial tools of the CLF and NCUSIF.

Late Reporting and Changing the NCUSIF’s Accounting Standard

Until 2009, “the NCUSIF historically prepared its financial statements in accordance with accounting principles generally accepted in the United States of America (“GAAP”), based on standards issued by the Financial Accounting Standards Board (“FASB”), the private sector standards setting body.”

The issue following this standard was whether US Central and or Wescorp, conserved in March,  must be consolidated with the NCUSIF under the Variable Interest Entity (VIE) rule. As a subsequent event and prior to the completion of the December 2008 audit, the VIE presentation needed to be resolved. As stated in their audit, this situation was one indication that NCUA did not fully grasp the consequences of their actions.

The resolution of this was described in the audit notes for 2008:

It was concluded that for 2008 the NCUSIF would be the primary beneficiary of certain identified VIEs based on variable interests held by the NCUSIF at December 31, 2008, and therefore, the NCUSIF would have been required to consolidate such VIEs in its financial statements for the year ended December 31, 2008. However, based on the actions discussed below, it was concluded that the TCCUSF would be the primary beneficiary of these same VIEs based on variable interests held by the TCCUSF at December 31, 2009.

The shift in primary beneficiary from 2008 to 2009 was the result of the June 18, 2009, actions of the NCUA Board to transfer the legal obligations related to CCUs from the NCUSIF to the TCCUSF. Such actions relieved the NCUSIF for the costs and related obligations of stabilizing the CCU system, as provided by Public Law 111-22, which was enacted May 20, 2009.

This change in reporting entity has been applied retrospectively to 2008. Accordingly, the accompanying financial statements for the year ended December 31, 2008 do not reflect the consolidation of any CCUs.

Avoiding Private Auditing Standard Requirements

To avoid VIE accounting requirements, NCUA in its September 16, 2010 public board meeting adopted federal GAAP.  These are excerpts of this discussion:

Mary Ann Woodson, the agency’s CFO at the time: The purpose of this action is to request Board approval for the National Credit Union Share Insurance Fund to adopt accounting standards promulgated by the Federal Accounting Standards Advisory Board, also known as FASAB. These standards are also commonly referred to as Federal GAAP.

The Share Insurance Fund currently applies Financial Accounting Standards Board, or FASB, standards. These accounting standards are used by commercial businesses in keeping their books and records and in preparing their financial statements.

On June 17, 2010, the NCUA Board adopted FASAB accounting standards for the Temporary Corporate Credit Union Stabilization Fund. Since then, we have gained more experience with FASAB and we have seen firsthand that FASAB standards more appropriately meet the financial reporting requirements of the NCUSIF and its stakeholders. Also, FASAB is the preferred standard for federal entities. . .

Debbie Matz, then NCUA Chair: So, if we had switched to this before last year, we wouldn’t have had the long drawn-out issue with the auditors that required us to meet with FASB in order to get a clean audit opinion at the end of last year, but it would have eliminated the inconsistencies and vagaries that created that situation?

Mary Ann Woodson: Certainly it would have helped. Yes.

Debbie Matz: Well, then I support it. Thank you.

Both auditing firms commented that NCUA did not understand or follow basic auditing procedures whichever standard was in place:

The 2008 and 2009 NCUSIF audits  released on June 10 and 11, 2010 included auditor’s comments on accounting deficiencies. The 2008 Deloitte audit reported “material weakness” in NCUA’s failure to “properly identify the appropriate accounting treatment under Financial Accounting Standards Board (FASB) Consolidation of Variable Interest Entities with respect to its variable interests in certain corporate credit unions.”

KPMG’s 2009 audit reported a “significant deficiency.”  The SIF, the report states, “does not have sufficient staff resources with the experience in technical accounting and reporting requirements that the entity requires to consistently perform certain internal control activities, particularly those related to the preparation and review of the financial statements. . . The SIF does not have procedures in place that require review and approval of the journal entries and related supporting documentation.”

Adopting a Misleading Accounting Standard

In this 2010 board meeting NCUA  adopted federal GAAP as the “preferred standard for federal entities.” But it did so only for the NCUSIF in order to avoid certain disclosures according to Matz’s question. However the Operating Fund and CLF continued and are still audited using FASB GAAP.

The problems adopting Federal GAAP are much greater than VIE disclosures. First the NCUSIF is not a federal entity, but rather a cooperatively funded capital reserve for the credit union system. There are no federal appropriations or funds involved.

Investments are in Treasury securities, but that does not make the NCUSIF a government entity any more than it would a credit union holding the same investments. The NCUSIF is totally privately funded and only for credit union system use.

The Federal GAAP income statements and balance sheets are confusing and misleading for credit unions. As explained by Woodson, the agency’s then CFO: “Under FASB, or commercial GAAP, the focus is on netting revenue against expenses for either a net income or a net loss. Under FASAB, or Federal GAAP, the focus is on the cost to government. So we start with the costs and reduce that amount by any revenue earned, to get to the total cost of operations, or said another way, the net cost to the government.”

Under FASAB the focus is on separating transactions within the government from those with the public.  But all NCUSIF transactions are with credit unions, that is, the public.

The FASAB balance sheet presentation and income are prepared to show these two activities, but are totally irrelevant to how the NCUSIF operates. The numbers presented in this manner are at best confusing and at worst, misleading.

For example, under Federal GAAP the fund’s retained earnings are described as the Cumulative Result of Operations. This description includes unrealized gains and losses on the NCUSIF investment portfolio which can  over or understate actual equity significantly.

In the NCUSIF fiscal 2020 results using Federal accounting, it reported a $500 million increase in its net position to a total of $5.1 billion. However, the actual net income from operations was only $32.9 million. This  number is nowhere in the Federal GAAP statements-but reported on Slide 3 in the NCUA’s staff December 31 presentation to the board using private GAAP. This substantial  difference in the increase in total equity of $400 million versus operating income of $33 million is due primarily to including additional  unrealized gains in NCUSIF investments from the prior year.

NCUA staff reports the total of the federal Cumulative Result in its slides.  But when calculating the NOL, staff eliminates any unrealized gains or losses  highlighting the confusion between the two standards when presenting financial performance.

The difference in NCUSIF’s actual retained earnings and “cumulative results of operations,” varies by hundreds of millions each year (2008-2020) as shown below.

However the most serious defect in federal GAAP is that  “fiduciary assets” are non-governmental and therefore not  on the NCUSIF’s balance sheet.  These are all of the AME’s  including the corporate estates which total  billions.  They are in effect off the books.

As stated at the top of the AME financials issued by NCUA, the amounts are unaudited.  Under private GAAP these amounts would be audited and included  on the NCUSIF’s balance sheet.  Currently the amounts for corporate and natural person AME’s are presented  in Federal GAAP as “net”  receivable assets subject to various accounting and income recognition rules.

Using the Proper Accounting Standard in a Consistent, Transparent Manner is Critical

To evaluate the NCUSIF’s financial design and capital adequacy, an essential first step is adopting private FASB accounting. This is how NCUA staff routinely presents the board with NCUSIF slide updates—except for the balance sheet entry showing “cumulative results of operations.”

Returning to this accounting standard will help all users more easily understand when monitoring the fund. It will:

  • Present financial performance in a standard balance sheet and income statement format readily understood and monitored by credit unions;
  • Restore the NOL calculation as was done from 1984 through 2000. The misleading recognition of the 1% deposit, citing a billing delay, is inconsistent with credit unions’ standing legal liability and misstates the fund’s actual NOL status at yearend.
  • Bring more rigorous consistency to estimates of loss provision expense. Since 2009 there has been no relation between the provision expense and actual cash losses.
  • Shed greater insight into NCUA’s decisions including the management of its investment portfolio, the AME’s and the probability of premiums or dividends at yearend.

These accounting distortions have contributed to questions about the fund’s sufficiency and flexibility in a low rate environment. This is an important issue in the current environment. But it can only be analyzed if there is a rigorous, objective and consistent presentation of performance.

The fund’s revenue is primarily dependent on the yield on the investment portfolio. But whether that will be a factor causing a premium depends on two other critical events:

  1. What is the expected level of actual losses to the fund (versus the seemingly arbitrary loss provision expense)?
  2. Will the NCUA’s ever growing  expenditures transferred to the NCUSIF be brought into better alignment with proportionate share of state insured credit union risk?

Tomorrow I will present the NCUSIF’s cumulative performance from 2008-2020 to address the question, does the unique NCUSIF design still work after the two worst financial crises since the Great Depression?