At a recent reunion a colleague told a story of his granddaughter’s college interview. The panel was professors and tutors from the college. Her area of study was liberal arts not science.
How might you or your grandchild have answered?
She paused for a time, then said: ” I don’t know the answer. But here is how I would test to determine what might be the situation.”
She was admitted to the college.
Many personal decisions and business options do not have factually provable answers. Such as 1 + 1 = 2. Experts, analysis, prior examples and other learning can suggest possible options. But ultimately many outcomes are unknowable and require reflective judgment.
A Credit Union Example
Last week a credit union professional asked, do credit unions have too much capital.? He provided no background, just the question.
I asked several credit union leaders how they would respond. Their universal answer: “it depends.” They said each credit union’s circumstances are different–the member base, the area’s economy and multiple other factors. . This is something each credit union must determine for itself.
This may be procedurally correct. However, is there a conflict as the persons making the decision benefit most from overcapitalization? One former CEO of a large credit union publicly stated that a net worth ratio over 7% is “stealing from the members.”
Higher net worth takes some of the performance pressures off management and boards. Unlike public companies, there are no market comparisons forcing them to meet a minimum level of return on equity, or ROE. This is the primary measure of effective capital management.
Is a more objective standard required? The distribution of capital ratios suggest the question of overcapitalization is widespread.
The Capital Distribution of Credit Unions Today
This is the distribution of net worth ratios for all credit unions at yearend 2025. NCUA’s rule states that 7% equity ratio is considered well-capitalized.
Net Worth Ratio
# of CUs at
12/31/2025
Total Assets
13+
1,982
$408,743,666,638
12-13%
422
$246,934,302,564
11-12%
457
$520,062,897,151
10-11%
514
$523,027,212,223
9-10%
499
$428,895,471,832
8-9%
304
$264,042,605,226
7-8%
136
$57,902,263,277
<7%
61
$7,407,376,727
TOALS
4,375
$2,457,015,795,638
At the highest ratio level, 45% of credit unions hold 17% of assets or almost double the well-capitalized rule. A number of these are smaller credit unions, but there is at least one top ten credit union in this tier.
Most credit unions report annual increases in net worth, no matter the level, as a success indicator. The common expectation as to how much capital is enough is one word: more.
Because leaders may not know a precise answer, this does not excuse the need for objective processes and relevant comparisons for setting a maximum level and for returning excess net income to members. Effective capital management begins with ROE. Pubic markets generally expect outcomes in the 10-12% range as the minimum standard.
Answering Questions of Judgment
Do plants have feelings? The too much capital question can be answered by every credit union. The analysis should be transparent for members. It is an example of management’s accountability to members of their stewardship of the collective savings.
Public presentation of a capital cap is a sign of thoughtful management. “More” is not a capital plan. Nor is an ever increasing net worth ratio a success.
A cap may even be more important in an era of market exuberance with bank buys, fintech investing and crypto partnerships announced almost daily. A capital maximum could bring some much needed discipline in situations where overcapitalization seems to be “burning a hole in management’s pockets.”
One consequence of the 44 day federal governement shutdown is the absence of timely macro data on the US economy. Fortunately for credit unions there is another option to track the state of the movement.
Each quarter after the vast majority of credit union call reports have been filed, Callahans offers a preliminary financial and operational analysis of important industry trends.
Today at 2:00 PM EST the firm’s Trend Watch broadcast will give the September 30, 2025 year-to-date performance numbers. It’s free. You can sign up here. (link) or directly enter (link)
Three Reasons Why This Update Matters More Now
With NCUA short-handed, this will be the first and most timely status report on the state of the industry–the positive trends and areas of concern. Individual credit union reports are available to be downloaded from the Peer analytical tools offered by the company.
Although the federal government has reopened, normal monthly economic reports on jobs, unemployment, GDP growth and inflation for the months of September and October were not produced. In some cases the missing data points may not be replicable because they rely on contemporary personal interviews with households during the month .
Another example from yesterday’s Marketplace Daily Wrap: “The last time the Census Bureau gave its monthly report on retail sales in this country was two months ago. Those figures were for August.
3. Because there is a gap in macro economic trends and recent data, analysts must rely on the private sector, especially company’s quarterly reports. These will be the primary data source to evaluate the economy’s overall trends, especially consumer spending.
This week third quarter financial results from several big retailers, Home Depot, Lowe’s, Target and Walmart will be announced along with their future outlook. Their revenue and profit trends will be vital to interpret consumers’ economic resilience.
Those firm’s nationwide sales will indicate whether consumers may or may not be tightening their wallets in the short and medium term.
Credit unions provide valuable insight especially on the lower and middle parts of the income spectrum. What are savings trends? Are loans increasing and in what categories? Are there signs of consumer financial pressures from delinquency numbers in credit cards, indirect autos or even student loans?
The Value of Context for Local Outcomes
Credit unions serve very specific or small areas of the consumer economy. Their local circumstances may not follow national macro trends. That economic diversity is critical to overall system soundness.
But knowing the system’s year over year growth rates and other critical trends can provide important perspective for the remainder of 2025, as well as next year’s budgets and plans.
When traditional data sources are lacking, a credit union advantage is their willingness to share with their peers how they see priorities for the future. Callahans will be the first chance to view this across the entire spectrum of credit union place and asset size.
Tune in at 2:00 PM. Send in your questions or comments via the chat.
Vendor relationships are an essential requirement of managing a credit union. All credit unions contract with an external vendor for their core processing operations and many ancillay addons.
Only one or two of these vendors are credit union owned CUSO’s. The others are for profit companies some privately owned and others public. Some serve primarily credit unions; others the entire financial market.
Credit Union DP’s Market Share
The largest market share for critical back office operations is Fiserv. In a 2024 survey, they served 1,264 credit unions or 27% of the total market. This share is provided through almost a dozen core options. This variety reflects FiServ’s business model of growth through acquisitions of independent credit union dp providers.
The next highest dp vendor’s share is Jack Henry with 544 credit union clients on a single platform.
A $30 Billion Loss in Market Cap Creating a Decline of 42-44% in Share Price
Yesterday Fiserv announced its operating results for the third quarter. The surprise result stunned the market. From Bloomberg’s Evening Briefing:
Fiserv stock suffered a record plunge after the fintech slashed its outlook for full-year earnings and unveiled third-quarter results that confounded Wall Street analysts. Chief Executive Officer Mike Lyons, who took the reins in February, said he discovered that Fiserv wasn’t going to be able to deliver on its previous promises after a broad-based review of the business in recent months. Lyons’ predecessor running Fiserv was Frank Bisignano, who left to join the Trump administration.
“More financial surprises emerged in the start of Q3,” Lyons told analysts on a conference call. “That prompted not just the annual strategic planning process, but this much more rigorous review into our financials. And that was also driven by some of the stuff we’re hearing from our clients.” (emphasis added)
Analysts expressed surprise at how quickly the business appears to have soured. Trevor Williams at Jefferies said the magnitude of the earnings miss and forecast cut “is difficult to comprehend.”
“To be frank, we are struggling to recall a miss and guide down to this degree in any of the sub-sectors we have covered during our time on the Street,” Matthew Coad, an analyst at Truist Financial, said in a note to clients.
What’s Next for Fiserv? For its Credit Union Clients?
The most revealing phrase in Fiserv CEO Lyons call was the reference to some of the stuff we’re hearing from our clients. That is pretty frank talk from a CEO facing a market confidence meltdown.
What’s next for credit unions? With up to twelve different core solutions and serous earnings pressures, some consolidation forgreater efficien would seem inevitable.
In addition to being aware of what changes may be coming, the next important question is what are my options? For the short run? And the longer run when my dp contract is up?
This uncertainty will put the focus on other credit union dp providers, especially those who may be credit union owned. Or credit union focused vendors who would appear to be financially stable, and not positioning for an eventual windfall sale to an outside party.
With all the public focus on new technology, it is important to remember the value of long term reliable relationships. The unique credit union solutions of creating CUSO’s to serve common tasks becomes more promising than ever. While CUSO’s must compete with for profit alternatives, often with greater resources, they do not confront the prospect of market sell offs driving business decisions.
Whatever the outcome of Fiserv’s fall from market grace, it should prompt a greater awareness and examination of each credit union’s core provider. What do you know about the company’s financial circumstances and client satisfaction?
In a response to yesterday’s post citing PenFed, a member sent me the following notice requirements for an owner to be nominated for an open board potions at the credit union.
The 1% standard cited would require 28,128 member signatures based on the latest call report. It is a mere pretense of democratic owner control.
The member added this comment: Credit unions are becoming more like Fortune 500 companies every day. They exist not to meet the needs of customers or shareholders but entitled corporate executives.
The notice also contained short bios of the three board nominated candidates. The first is a retired army colonel who has been on the board since 2008 and serves on the Planning Committee.
The second is a retired USNR aviator who served for ten years on the Supervisory Committee before “joining the board” in 2022. He also serves on multiple committees including planning and risk management.
The third board nomination joined the board in 2005 and has just retired from a 38 year career working for the federal government. This person is the board treasurer and chair of the financial and risk committee and on the planning committee.
All have earned advanced degrees and have served in multiple professional civilian roles. No one would question their credentials. However their candidate descriptions include no statements about their priorities for the credit union and its current performance.
PenFed’s Recent Trends
At September 2023 PenFed’s total assets peaked at $35.4 billion. As of this June the total was $30 billion. This $5.4 billion asset decline is a continuing trend. In the 12 months ending June 2025, shares have fallen by over 10% or $3.0 billion, and loans by 13.2%, or $3.6 billion.
In the income and expense comparison for the first six months of 2024 and 2024, total revenue is down 14.1% and operating expenses by 3.75% The net income for both half years is positive with ROA’s of .27% and .54%. However these results were achieved by recording “non opeating gains” of $86.3 million and $95.3 million in the two periods. Otherwise, net income would be negative. Non-operating gains result from the one time sales of assets such as buildings or loans.
In the past 12 months, there has also been a decline in the number of branches (4), employees and members. It has downsized its balance sheet by reducing external borrowings from $3.8 billion at December 2023 to $756 million as of June 2025. The reduction in total assets has resulted in a net worth ratio between 9% and 10% even with minimal earnings in the past 24 months,
In sum, PenFed is moving steadily backwards.
The Strategic Catbird’s Seat
PenFed has one of the oldest and most recognizable brands in credit unions. It portrays strength and security suggesting a direct affiliation with the government. The credit union has an FOM charter open to anyone, reporting 342 million potential members.
During the past decade, the credit union has merged over 25 credit unions across the country, acquiring their equity. Often, after a brief transition, the local branches are closed, employees laid off, members offered only virtual services, and the buildings and other assets sold. The local legacy relationships, representation, community presence, and reputation are gone.
PenFed has had strategic advantages many other credit union’s covet. Scale, open membership, diverse products, a recognizable brand, multiple acquisitions of other credit union with their equity and increasing conversions to virtual and remote services. Yet it is in decline.
Where Are the Overseers?
These declining financial trends have taken place for at least the past two and a half years. What has the board been doing? What changes have been tried?
Members are not being served well by their director representatives. But what recourse do they have other than to close their account and leave?
This situation is a concrete example of why member-owner elections are important versus the habit of routine ratifications of board incumbents. All three PenFed nominees would seem to have exceptional credentials. But in practice they are shepherding a significant institutional dwindling.
The financial engineering to maintain a net worth above 9% by selling off assets to record non operating gains is not sustainable. Does the credit union even have a plan or leadershlp capable of reversing this diminishing?
This situation is why annual meetings should matter. Elections are moments for accountability not merely PR exercises. Democratic elections empower owners and promote leader responsibility. In the absence of member participation, there is no answerability by those in leadership positions.
When the regulator is the last resort for addressing financial and operational shortcomings, the credit union has lost its autonomy. And member-owners’ needs are sidelined to meet the priorities of the government overseer.
When democracy as the means for leadership accountability is abandoned, the outcome is rule by habit or authority. Neither is a sustainable approach for long term success.
On February 6, the $612 million Thrivent FCU announced that its members had approved the credit union’s purchase by the Utah licensed Thrivent Bank (in formation).
More than 33% of the credit union’s 52,000 members (47,872 eligible to cast a ballot) voted with 79% in favor of the charter change. NCUA regulations require that at least 20% of the membership must vote on this charter conversion. The “merger” is scheduled to be completed by May 31, 2025.
Special Dividend Distributes Net Worth
The member-owners will receive a special dividend of $76 million which is the credit union’s fair value as determined by an independent appraisal. This amount equates to a 12.2% “dividend” on the shares owned at the time of the announcement. As described in the Members’ Notice:
The TFCU Board of Directors has determined that in conjunction with the Merger, the members will receive a total distribution in the amount equal to the full (credit union) valuation of $76,000,000.
Members also have full access to their $617 million (December 2024) in shares should they choose not to keep them at the newly chartered bank. The Thrivent FCU board had previously assured members there would be no changes in rates or terms on loans and savings transferred to the bank.
The First Sale Since 2006
A full description of Thrivent’s proposal is in my December 3, 2024 blog . It provides the credit unions financial standing as of the announcement in June 2024
The last time a bank bought a credit union was the sale of Nationwide FCU to its sponsor, Nationwide Insurance. In that 2006 transaction the members received their entire net worth back resulting in a special “dividend” on shares of approximately 15%.
Depending on the financial position at the time of closing, both “merger” transactions valued the credit union at approximately 1.0 to 1.3 times book value. For example Thrivent’s total GAAP capital was $80.8 million at December 2024. However, if the $26.5 million decline in the market value of investments is recognized the net equity falls to $54.3 million.
Background on Thrivent FCU
Credit Union Times published a history of the credit union and the newly formed Thrivent bank’s business plan in a June 25, 2024 report: Thrivent FCU to Merge Into Thrivent Bank. The article states the new bank will offer digital service only from one location in Salt Lake City. The primary reason for this conversion was to access the capital resources of the sponsor, Thrivent Financial.
The Times article pointed out that since the December 2012 date of Thrivent’s initial conversion from a bank, the credit union’s assets had doubled from $478 million to $930 million. Loans had increased from $341 million to $635 million.
As of December 2024 Thrivent FCU’s shares, loans, members, and assets have declined compared to the 2023 year end results. The most recent December call report shows net worth at 10.3% and ROA of.46%. Delinquency is only .29%.
Extending the Credit Union’s Mission
In Thrivent’s press release reporting the vote, Board Chair Beth Lewis states: “The merger opportunity with Thrivent Bank will extend the mission of our credit union and provide our members with simple and competitive banking products, easy-to-use digital experiences and direct access to human support. Our board of directors is pleased that a majority of our members came to the conclusion that this merger is in their best interest.”
The TV story told of the $13.6 million dollar loss at Creighton FCU leading to its subsequent merger with Cobalt FCU in August 2024. Cobalt said this was the result of the “CEO’s retirement.” Both Peter Strozniak’s Credit Union Times article and I had written about this forced merger and the loss in its final June 2024 quarter of operations.
The merger was caused by an enormous deficit equal to 20% of assets uncovered following the CFO’s death in April. NCUA gave no explanation of what happened, where the money went or who was responsible for the follow-up. NCUA and Cobalt refused to answer any questions about the event. Problem resolved, no questions please.
But the TV news triggered immediate additional facts that NCUA has refused to provide the press and public about its actions. The TV reporter received a letter NCUA’s Inspector General (IG) sent to Omaha Congressman Mike Flood responding to his inquiry about the circumstances of the loss in November.
The IG response is linked here. The letter opens with an unusual disclaimer of direct responsibility as the IG and NCUA are not required to investigate this situation any further:
Because there was no loss to the Share Insurance Fund, my office was not required to perform a material loss review. Additionally, NCUA informed us that the agency was not required to conduct a post-mortem review for the same reason.
But the IG then proceeds to state facts from the public 5300 call report and details of all the external resources and NCUA officials who became involved when the CFO died in April. Those listed include a local CPA firm, the NCUA’s supervisory examiner, the regional director, associate regional director, the director of special actions and a problem case officer. NCUA requested the credit union hire a bond attorney, fraud auditor and an interim CFO to work with its problem case officer. On May 3 the case was transferred to the Western Region’s Special Case office on May 3.
The only NCUA offices not listed are those ultimately responsible for the oversight of NCUA’s federal credit unions: the Executive Director, the Director of Examination and Insurance and the NCUA board. By omitting any mention of their role, they are apparently excused from any accountability.
In October 2024 Cobalt reported to NCUA that the “former CFO understated expenses related to the ATM network to artificially boost Creighton’s income statement to appear to achieve a steady net income.” The IG’s explanation also includes this assertion of agency’s due diligence:
When reviewing the deceased CFO’s family financial records and computers that:The regional director also said the fraud auditors looked for all ways cash could have left the credit union and found no instances of cash removal.
The IG’s concluding paragraph provide NCUA’s theory of the case:
In summary, NCUA officials believe the credit union failed due to bad accounting and financial statement fraud. The large deficit was hidden by the former CFO who exploited Creighton’s weak accounting system that allowed back posting, forward posting, deleting transactions, and hiding general ledger accounts when generating reports. Because no money was found to have left the credit union through this, NCUA officials believe the former CFO committed the fraud not for personal financial gain, but to make the credit union appear to be thriving in the eyes of its Board and membership.
The IG’s Theory of the Case
Several observations from the IG’s summary. First all the information is second and third hand. The IG did not complete any direct review, but solely reported what others have said and done.
If this preliminary description is accurate, one has to believe this accounting coverup occurred over at least 26 years with an average operating shortfall of $500,000 per year between reported and actual net income.
To accomplish this alleged coverup, the CFO would have to keep two complete sets of books. As the deficits were recorded from share balances this would require hundreds of individual entries each quarter to balance out the shortfall but keep member statements accurate. Then these two sets of books would need to be updated quickly whenever external NCUA examiners and auditors arrived on site. Or whenever there was any external loan and share verifications.
A person capable of this legerdemain bookkeeping effort for over 26 years was however not capable of managing the credit union’s financial performance with positive net income?
There is no explanation of how such a consequential scheme could have gone undetected from annual CPA audits, NCUA examinations. supervisory committee share and loan verifications and traditional separation of duties in the accounting shop. It was not discovered until the CFO’s death in April. New people quickly found the out of balance situation and the $13 million shortfall. The fact that the share shortfalls were recovered so rapidly and then transferred in full to Cobalt, suggests these two sets were readily available. An internal defalcation involving member share balances over three decades would normally be an auditing and forensic nightmare to reconstruct. But in this case resolved quickly.
Just Country Bumkins Fooling Experts
Finally, it strains credulity to believe there was no shortfall of funds. The cash had been received from the incoming share deposits. But the IG’s letter presents the assumption that the CFO just used “suspense accounts” to cover unrecorded continuing operating losses—that would average at least $500,000 per year. Why would a person go to this much trouble to just cover operating losses for which he was not directly responsible? If in fact it was failure to balance out ATM deposits and withdrawals—one suggestion—how could such a continuing imbalance go unnoticed for over three decades?
The IG report describes the accounting coverup: Specifically, the CFO had understated expenses related to the credit union’s ATM network to artificially boost Creighton’s income statement. And, The regional director stated that the ATM accounting was extremely complicated due to Creighton having over 150 ATMs and the multiple ways in which income and expenses could be divided.
A credit union of this asset and member size managing a 150 ATM network seems highly unusual. What happened to this system after the merger? Why were examiners and auditors unable to balance out this system for decades?
Assuming the CFO’s only rationale was to hide a continuing operating loss and that he received no benefit from his actions, one must ask who also might benefit from such a coverup? Who supervised the CFO? Is this just a situation of two country bumkins fooling all exam and auditing experts for decades?
NCUA’s Silence on This Failure
Until the IG’s December response to Congressman Flood’s inquiry, all responsible parties have said nothing about the situation. Press queries are referred to call reports and to Cobalt’s press release saying the merger was due to the CEO’s retirement, a completely false account. Why would the NCUA and Cobalt put out such a blatantly false and easily contradicted explanation? Was it to avoid addressing the $7 million or greater shortfall that Cobalt members will now cover?
One fact is clear, everyone, including the IG is distancing themselves from any responsibility for getting to the bottom of this $13 million loss. The IG presents second hand information and lists multiple NCUA involvements with everyone handing off the ball to someone else-either internally or externally. Cobalt does the cleanup. The IG quotes Cobalt’s theory of the loss from October, not NCUA findings, for the missing funds. The IG washes his hand because no “material loss” review is required, but he will consider adding a review to his 2025 “to-do” list.
When people in positions of responsibility have nothing to hide, they will speak up with their understanding of events and what more needs to be done. In this case there is silence for all parties, but most especially the highest levels of NCUA. The initial explanation of multiple decades of accounting coverups creating a $13 million shortfall seems unlikely and inconsistent with some of the data reported. It feels like there must be more to the story.
The True Shortcomings
NCUA’s lack of public candor is the real problem. No one at NCUA wants to take responsibility for the agency’s most fundamental role of overseeing a credit union’s safe and sound operation. Noticeably absent from IG’s account is the role of the three-member board, the information they received and the actions they did, or did not, take.
Did the Board approve the forced merger without member vote? If so, what was in the Board Action Memorandum about the situation and alternatives? Why was Cobalt FCU willing to absorb this accounting and operational mess with a $7.0 million loss which their members must now cover? Where is their upside, if any?
Why weren’t the previous NCUA annual (?) exam papers reviewed for how so-called unrecorded expenses could be disguised in other accounts (suspense and office expenses)? The three quarterly call reports clearly show the credit union reporting positive net income, but no increase in net worth until the yearend. Don’t examiners first review the accuracy of call reports as one of their first verifications? Etc. etc.
The Largest Credit Union Failure in 2024
The Creighton case is an example of institutional failures. The most serious is not the $13 million unexplained loss shutting down a federal credit union. But the total lack of responsiveness to the members and the public by NCUA’s leadership. In a crisis, leadership should come from the NCUA board members, not the professional staff. They are merely foot soldiers. The leaders are missing in action.
Is the best explanation NCUA can provide Congress and the public an IG summary of second-hand agency actions, a listing of all the professional resources sent and offering a third party’s partial explanations of what may have happened?
The buck should stop at the Board’s three desks. The board members are nowhere to be found or heard on the most significant failure in 2024. A long standing, apparently successful federal credit union collapses overnight and costs its members their institution and $13 million in combined resources.
More Precious than Dollars: Trust and Confidence
The NCUA board member’s inaction and silence when facing real problems in an open, prompt and responsible manner is a failure of leadership. Hiding from issues and accountability leads to internal coverups. It creates a lack of public confidence in the agency’s oversight. The perception that board members are not up to the agency’s most basic responsibility raises questions about their competency supervising other areas of credit union activity in which members good faith and trust (e.g.merger payouts) are routinely compromised.
After the TV investigation was reported on Monday, I received the following from a former Creighton member. It read :
Hi Chip – I ran across your coverage (in November) of Creighton Federal’s large shortfall. I am a customer there and had followed their directives to switch to Cobalt. Now I’m wondering if my money is safe at Cobalt! I liked some of Cobalt’s products (a money market savings account with high interest, for instance) and have been happy with their service so far. Still, your coverage of the slap-dash management at Creighton Federal, and its rescue by Cobalt has me wondering if I should move my money to another credit union in town that doesn’t have any problems (that I know of). Thanks!
Hopefully this case is at its beginning and the three members of Congress on the IG’s response will continue to press for actual facts, updated numbers and direct explanations for what happened. NCUA seems incapable of self-assessments. Credit unions should not expect perfection from their regulator, but they should have honest accountability.
Editorial update at 5:00 PM January 8.
Yesterday the WOWT station published this follow up report incorporating some of the IG’s December letters comments to Representative Hood.
I had the opportunity to listen to a very small slice of NCUA’s Board’s public budget process for 2025-26 by watching the video of the November 21 discussion of the CLF’s spending requests for the next two years.
Although extremely small in the agency’s overall spending totals, I fear we see clearly in this simple example, the board’s inability to substantively assess spending requests.
A Brief Background
Several items from the CLF’s board action memorandum for November 21 provide some background for the hearing including these two points:
The purpose of the CLF is to improve the general financial stability by providing member credit unions with a source of loans to meet their liquidity needs and thereby encourage savings, support consumer and mortgage lending, and provide basic financial resources to all segments of the economy. and,
“(CLF) is owned by its member credit unions and managed by the NCUA Board”
CLF’s budget proposals were for $2,307,863 for 2025 and $2,448,263 for 2026. Salaries and benefits are 96% each year’s requests.
Several facts put this credit union owned public-private effort in perspective.
Total membership is 430, an increase of 32 in 2024, and 9.4 % of all credit unions. CLF’s balance sheet is $966 million and includes $44 million of net worth/retained earnings.
The Board’s Policy Failure
Each board member remarked on some aspect or other of the financials. Otsuka had no questions. She made an unexplained reference to “protecting the insurance fund.” Hauptman called the CLF a “buffer for the American taxpayer” and cited a vague reference to $18 billion of loans sometime in the past.
He reverted to his standard routine of demonstrating how to improve the “user experience” when contacting the CLF. He showed how staff had “made it easier to access” the CLF by removing the on-hold music replaced by an automated telephone routing message. He confirmed that a credit union inquiry would ultimately end at the CLF President’s desk, if no one else picked up the call before then.
He also pointed out that 3,300 credit unions (95% of those under $250 million in assets) had lost access when the special CLF-Corporate membership authority expired. Hauptman opined that credit unions should have multiple liquid cash sources which is how he arranged his personal financial management: “a credit card, home equity line and a margin loan established with a broker.”
As Chair Harper led off the discussion, one would have hoped for a focus on CLF policy and whether its purpose above was being carried out. Instead, he supported the budget in full and noted the 31 increase of members. He did ask about the cost of membership. The 4.46% third quarter member dividend was the only recognition that the CLF’s return to the owners was below market rates including the overnight Fed Funds yield. He again complained about Congress not renewing the special CLF authority for corporates to join by funding only a subset of their members.
Business as Usual While Failing the Owners
A critical capability of any NCUA board member is discernment. What is their understanding of the key issues in a staff presentation, especially when focused primarily on budgets? Is It really about numbers? Or should it be about whether the CLF is serving its owners?
All three board members stated that the CLF existed for the benefit of NCUA and the NCUSIF, not for the credit union funding owners. What are credit unions getting for their direct support of the CLF? In the presentation the number one productivity indicator and primary 2025 Planned Activity goal is to Provide CLF Advances as needed.
However, the CLF has not issued a loan to credit unions since 2009. Almost all of those advances, 15 years earlier, were to two corporates via the NCUSIF. They were very short term and not part of any overall recovery plan. I am ignoring a token $1.0 million mini-advance made to a small credit union in December 2023 and paid off early in 2024.
A Time of System Stress
The lack of credit union support and CLF membership is not a statutory shortcoming. It is a management one, an NCUA responsibility as stated in the staff memo above. During the 2022 and 2023 rising Fed rate cycle, liquidity pressures increased throughout the system. This concern peaked when the Silicon Valley and other bank failures occurred. However the CLF was totally missing in action this entire cycle.
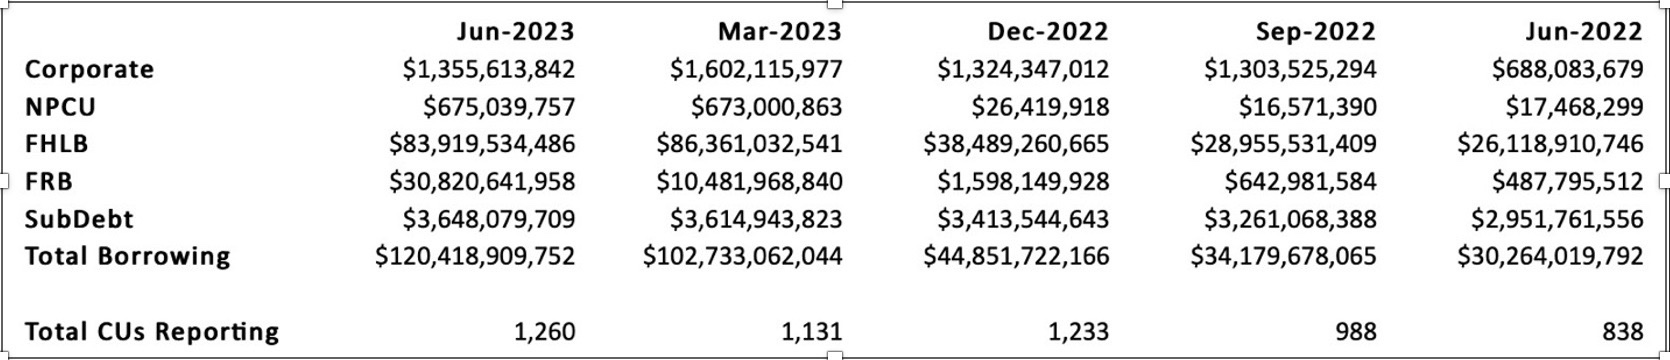
Instead, credit unions borrowed in record amounts from the Federal Reserve’s Bank Term Funding Program (BTFP) and the FHLB’s. For example, the September 2023 call reports show 307 credit unions with Federal Reserve borrowings of $34.9 billion, an average of $114 million. For these credit unions, the Federal Reserve represents 66% of their total borrowings. For 112 of this group, the Federal Reserve is their only source.
Credit union total assets of $2.25 trillion at 3Q 2023 were just 9.7% of total banking assets. However, their participation in the special emergency Federal Reserve lending program equaled 27% of the BTFP’s loans at yearend or three times cooperative’s share of total industry assets. And this Federal Reserve borrowing was only a quarter of all credit union borrowings at the quarter end of $130.3 billion.
During this entire liquidity crisis, the CLF was nowhere to be found, or even heard. No programs, no outreach, no public discussion. And it was not due to a poorly designed website or failure to target market. Rather the CLF’s credit union owners were completely left out and shut out of any role except sending in capital—for a below market return. The agency made no effort to assist credit unions because the board and staff view the CLF as a liquidity partner for the NCUSIF, not the industry.
Why the CLF Has No Interest is a post from May 2024 which shows that the credit union owners have been subsidizing the CLF due to its below market dividends. The CLF’s return is much less that paid by the FHLBs and corporates on their capital accounts. Even though the CLF has investment authority similar to FCU’s, its own portfolio was underwater at 2023 yearend and its yield trailed the overnight FF rate the entire year. But the board ignored those facts.
Credit unions do not view the CLF as a reliable partner in times of balance sheet stress. They have plenty of tested alternatives. Ones that don’t impose supervisory judgments on top of collateral security. The Board’s view of the CLF to serve the NCUSIF has made it a “vestigial organ” within the NCUA body serving no credit union owner-members.
What the Board Could Have Asked Staff
Following are some questions that board members might have asked if they had really focused on the CLF’s policy failures in this most recent period of liquidity need.
How many of CLF’s current members have outstanding loans elsewhere? How much and for how long?
What unused lines do CLF members report on the latest call reports?
Has the CLF developed any proactive lending programs in the two years since the Fed began raising interest rates in 2022? If yes, how were these communicated to owners?
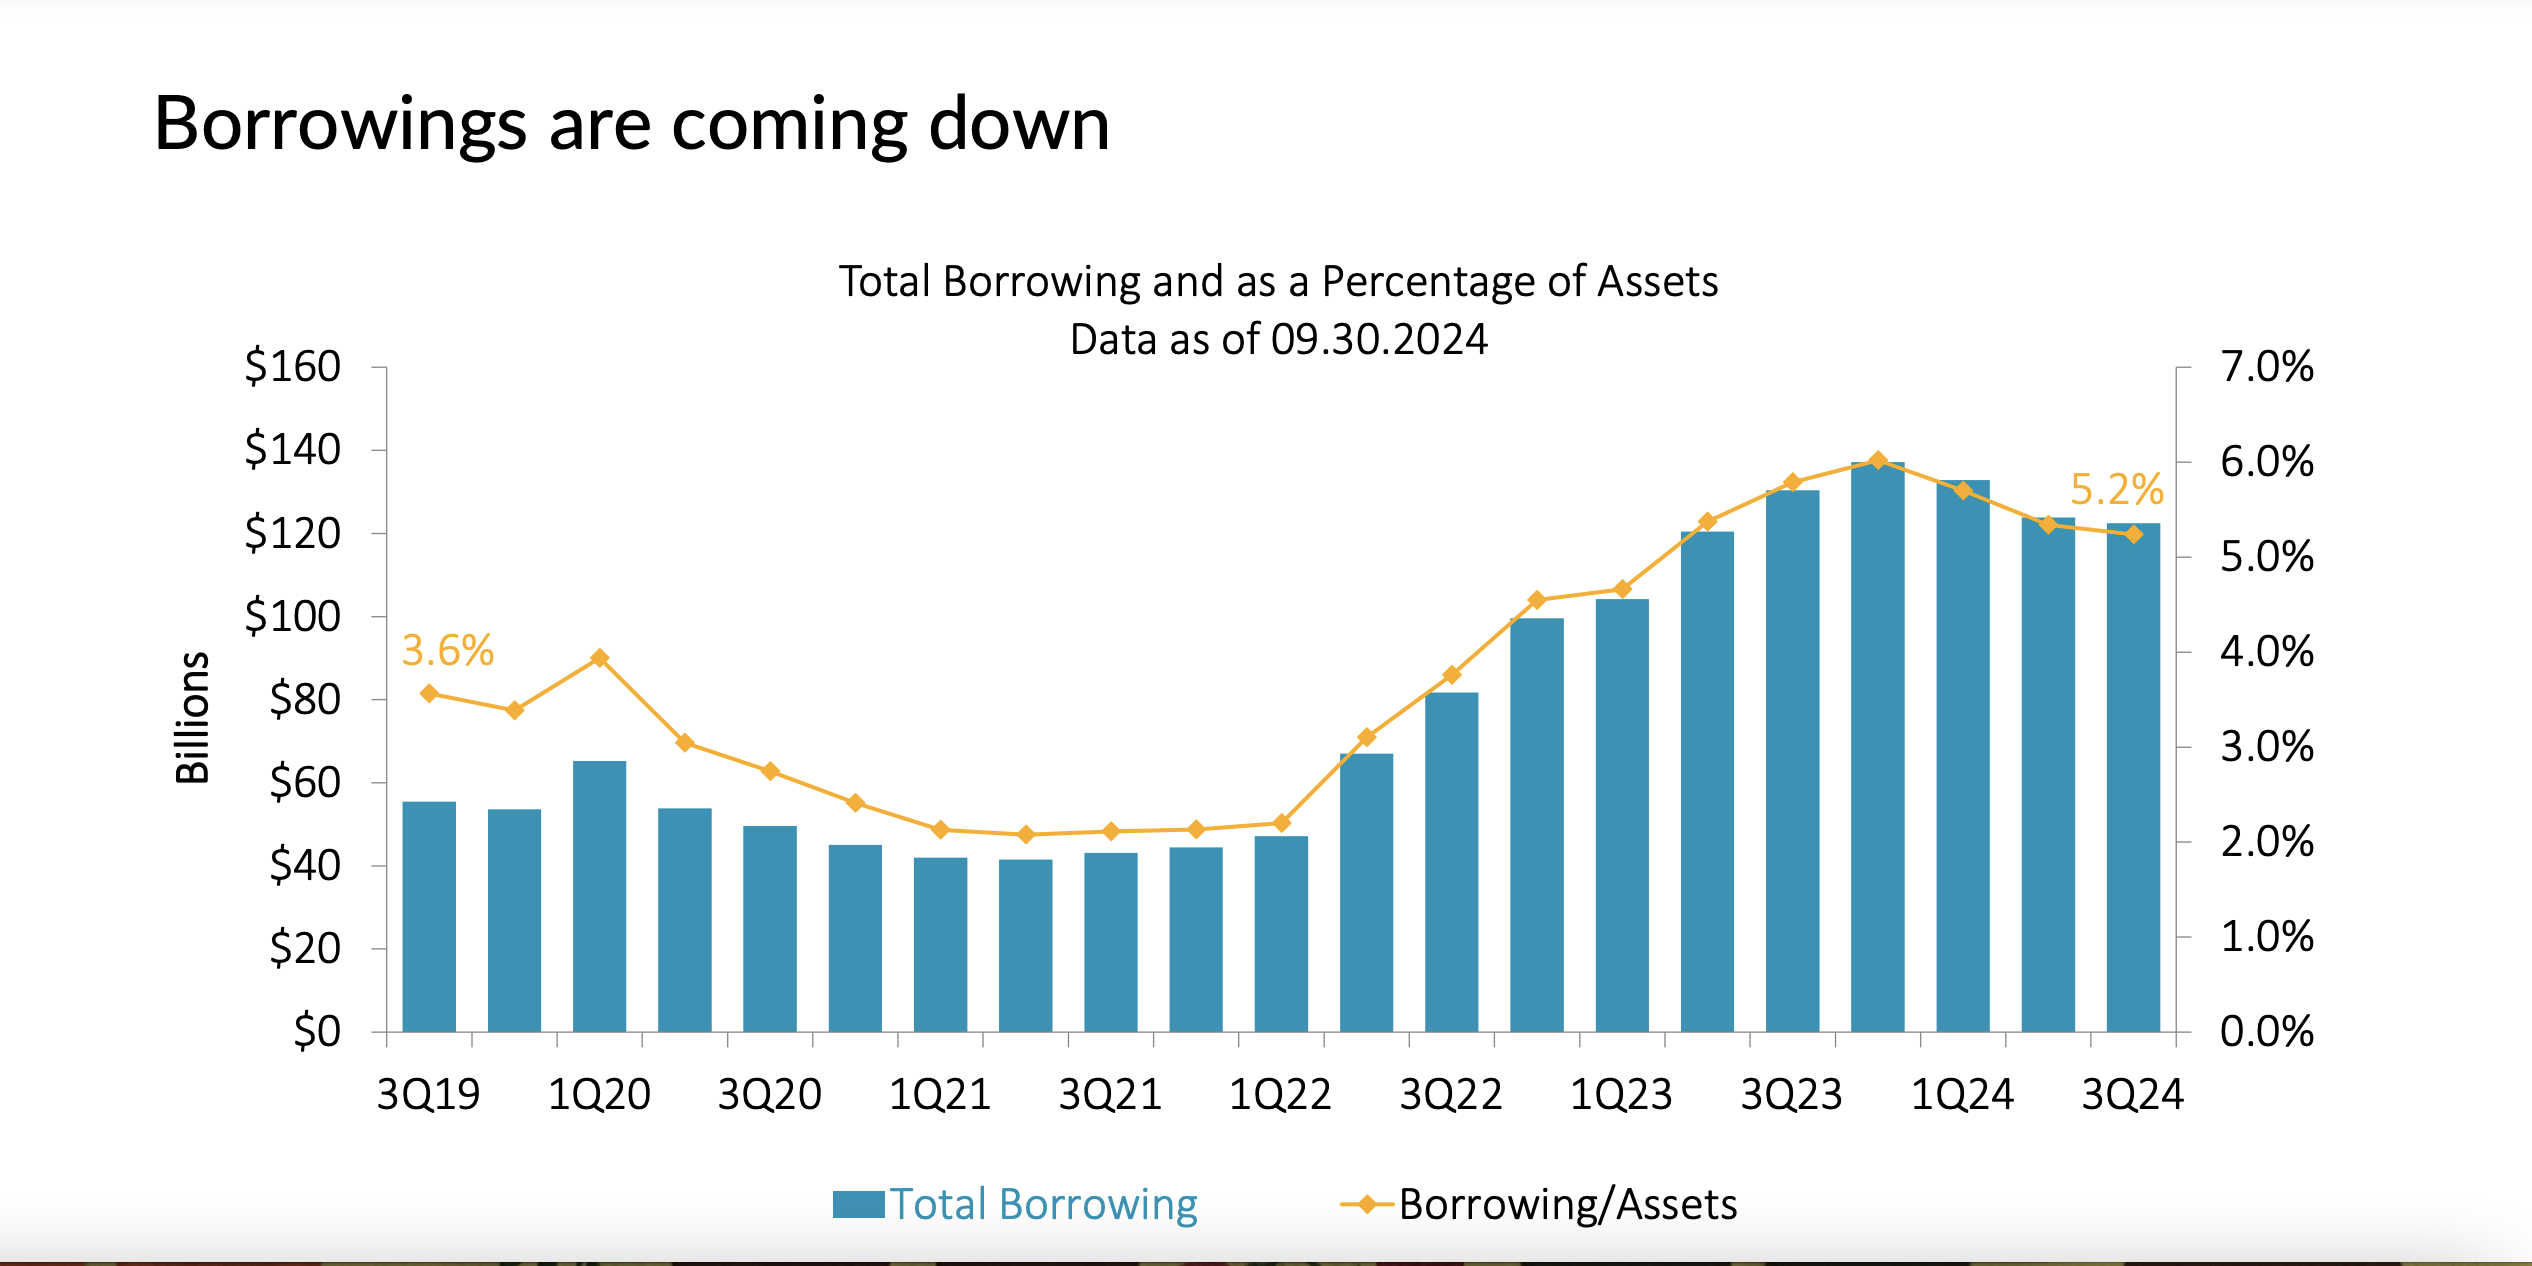
Given the dramatic increases in credit union borrowing in both total dollars and numbers as shown below, what did the CLF do during the crisis? The chart below would be updated as context for the question.
Total Credit Union System Borrowings (June ’22 to June ’23)
Why should the CLF continue as a separate department with a staff of six and overhead charged by the NCUA board, when it could easily be a collateral responsibility with other senior examination and supervision staff?
The failure of NCUA board members to ask the most basic questions about CLF’s non-activity while routinely continuing to increase its spending is disappointing. It undermines the NCUA’s capacity to serve the owners of the fund.
The board has failed in its policy oversight role. With zero lending productivity, why is there any reason for a staff of six to keep lights on? The entire system shows increased liquidity demand and draws but relied entirely on every other contingency funding source while its own funded resource was moot.
If credit unions are to get their money’s worth from the CLF, the agency must show leadership by working with the owners. Contrary to one board member’s assertion, CLF effectiveness does not depend on its members; rather it depends on the management by NCUA. Otherwise, just merge the shop back into the bureaucracy from which it came. Save the credit unions money.
Editor’s footnote: If you want to see how another cooperative designed liquidity lender communicates with its owners, read this latest update from the FHLB’s newsletter.
Biennially, the FDIC conducts a consumer banking survey and releases the results to the public. The report produced since 2009 traditionally measures the unbanked portion of the population. The 2023 data released on November 12 added several questions about two new financial services that have attracted much credit union interest.
The Report’s headline finding is that “96 Percent of U.S. households had credit union or bank checking accounts in 2023.” A record low 5.6 million households (4.2%) remain unbanked
Further data breaks down the unbanked by race and those that were “underbanked,” 14.2% of households. These consumers rely instead on payday loans, cash and other non-bank products.
For traditional relationships, 48.3% of banked households use mobile banking and 76.4% of all households had a credit card.
Between the surveys in 2021 and 2023, the data on new payment application shows “use of nonbank online payment services such as PayPal, Venmo, or Cash App increased, while the use of general-purpose reloadable prepaid cards decreased.”
The New Data In the Report
So much for traditional product tracking. The 2023 survey asked about household use of two newer financial services: Buy Now Pay Later (BNPL) usage and crypto purchases. Both products have raised much interest in credit union land.
For example, this December 2 article in Credit Union Times reports on the first credit union in Georgia to offer a BNPL product. The article quotes the credit unions fintech/CUSO partner providing the service: “Buy Now, Pay Later is a financial service that consumers want and are increasingly expecting from their primary financial institutions.”
The FDIC survey however reports that “only 3.9% of all households used BNPL in the past 12 months.” For many consumers, this option is just an extension of an existing credit card relationship, not a separate product.
As bitcoin passes $100,000 in value and then fell back, crypto is again on some consumers financial product short list. But how big is the market?
The FDIC data showed that “In 2023, 4.8 percent of U.S. households owned or used crypto or digital assets in the previous 12 months. A significant majority of these households held crypto or digital assets as an investment (92.6 percent) while only 4.4 percent of these households used digital assets as a form of payment.”
Again the urgency to offer purchases or other transactions involving bitcoin or other crypto “currency” would seem to be tempered by both the uncertain nature of the product and its relatively low penetration of households.
The good news is that traditional financial products are used by almost all households and mobile convenience continues to expand.
My earlier analysis, part 1, of the NCUSIF’s financial performance in 2024’s first three quarters, highlighted the fund’s soundness. It concluded with Board member Otsuka’s statement about the board’s role to be good “stewards” of the fund. This post shows how that oversight role could be improved.
The Benefit of Public Board Meetings
The board’s quarterly discussion of the fund’s performance is an important responsibility. It demonstrates each board member’s “grasp” of the subject matter, their preparation and their reasoning for any conclusions. Just like a credit union board’s role, their judgment is critical in overseeing staff’s recommendation.
It is in the board’s particular roles in this quarterly review, that the public learns each member’s understanding of general policy, especially the role of America’s cooperative financial alternative.
Additionally, NCUA’s monthly publication of the NCUSIF’s performance provides the fund’s cooperative owners the opportunity to monitor how their 1% deposits are managed by following critical financial indicators. This monthly update was a condition for the open-ended funding model of the 1% deposit by credit unions. If the trends are in the wrong direction, then credit unions have the facts to speak up.
Critical NCUSIF Financial Issues
The fund’s finances have one primary revenue driver, the yield on the investment portfolio. This was by design. It was a dramatic change from the premium based approach of the FSLIC and the FDIC which was also followed for the first 15 years of the NCUSIF’s operations. That premium model proved fundamentally flawed. That history is described at the end of this post.
The NCUSIF’s Investment Underperformance
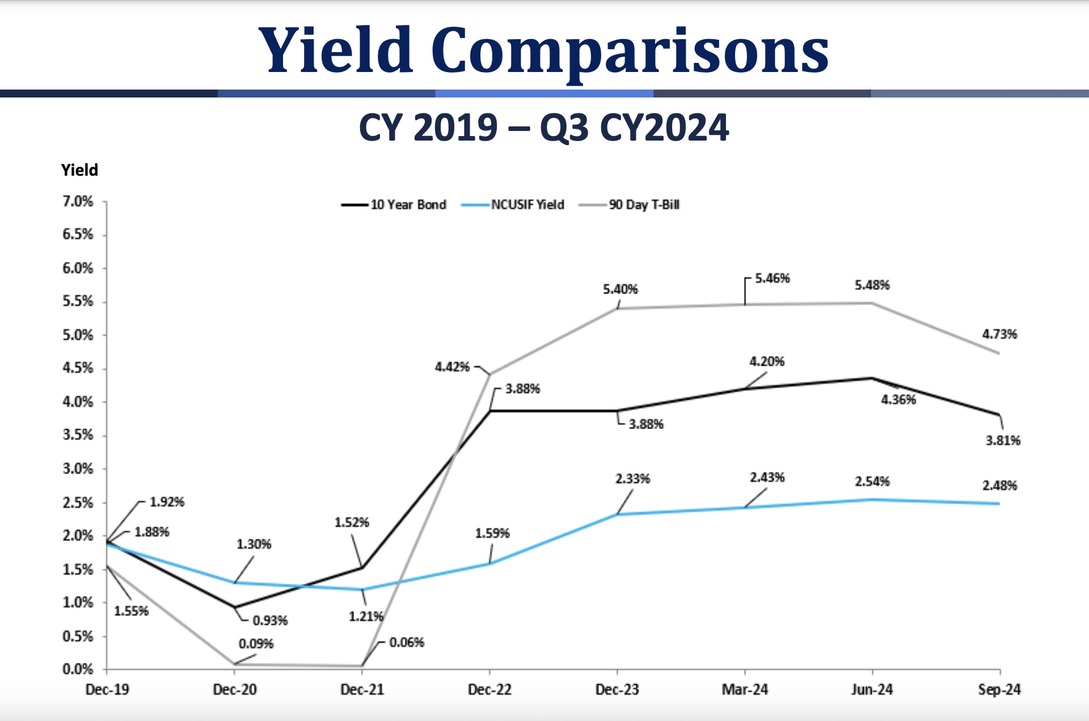
Slides from the September financials in November meeting clearly demonstrates the agency’s continuing shortcomings in managing the Fund’s interest rate risk.
The first tracks how the fund’s yield (blue line) began trailing its market indicators as of mid-2021.
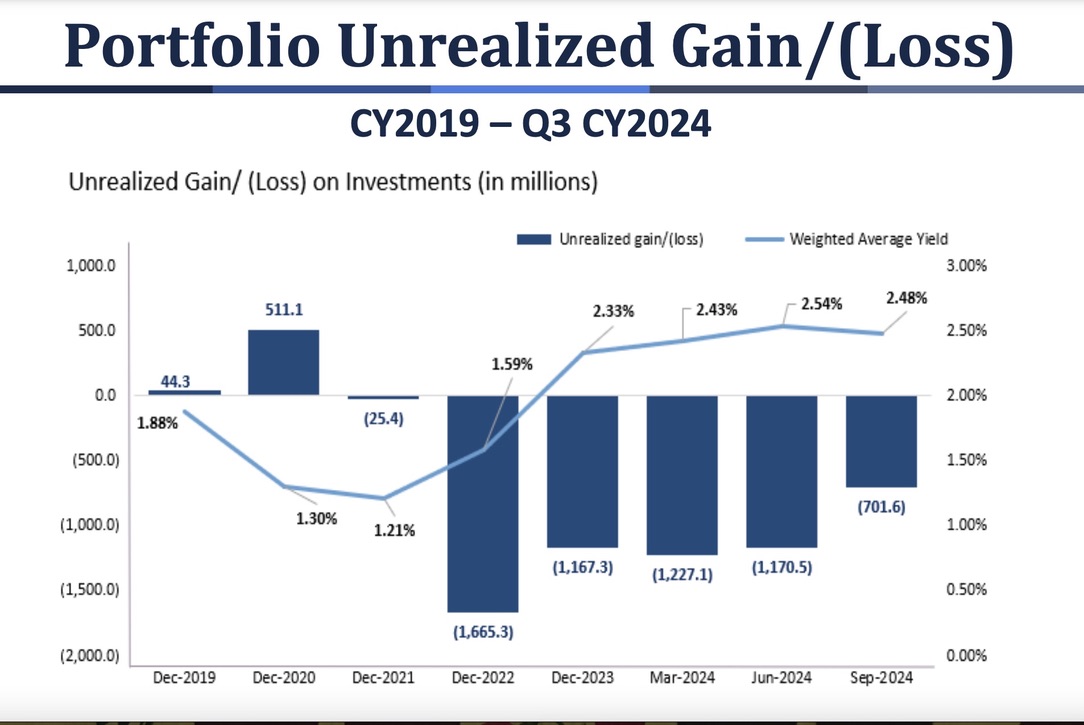
The next shows that the NCUSIF portfolio has been “underwater,” that is below market in value and return, since December 2021.
The first consequence of this portfolio strategy is that the fund’s primary revenue source is shortchanging the fund and credit unions. The second is that the majority of the fund’s investments are not readily liquid in the event needed without either borrowing or selling investments at a loss.
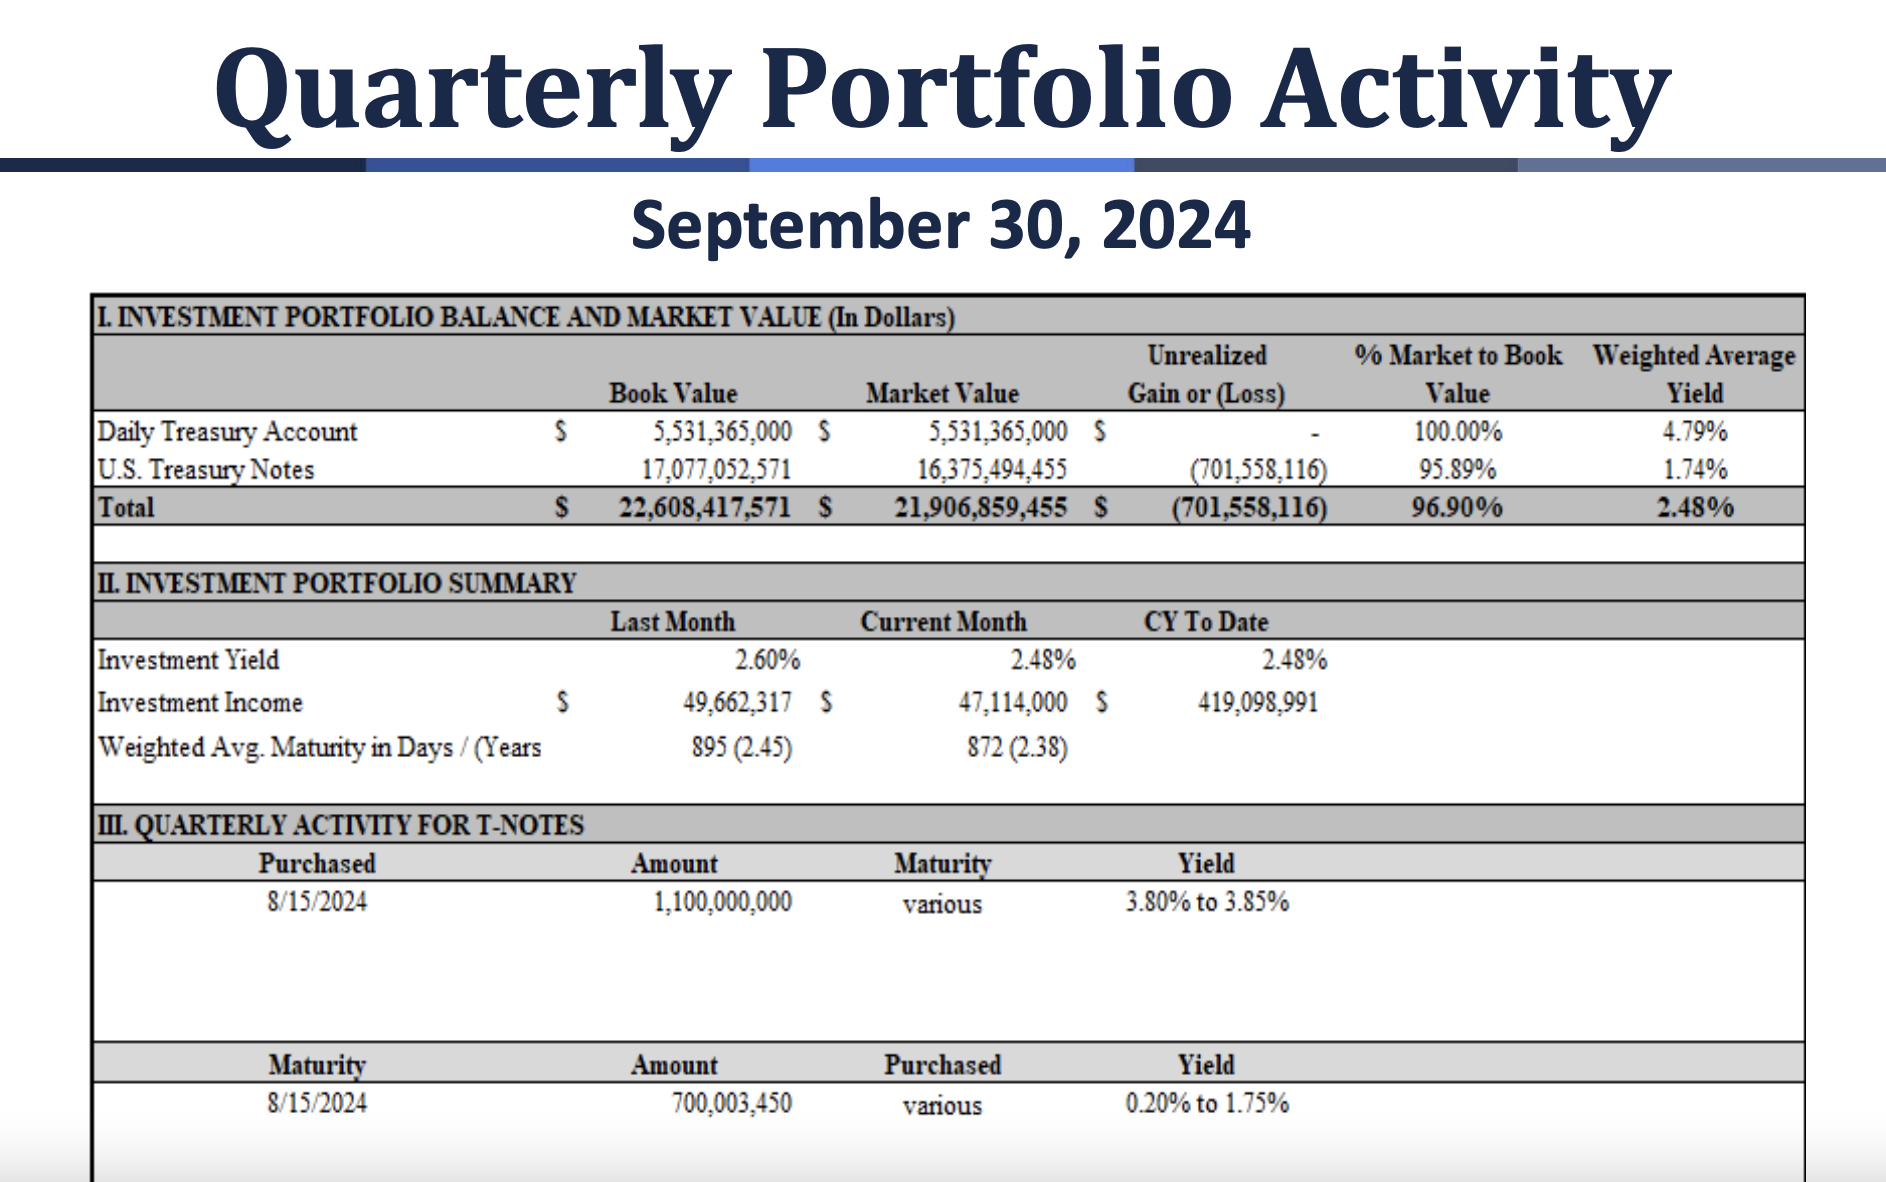
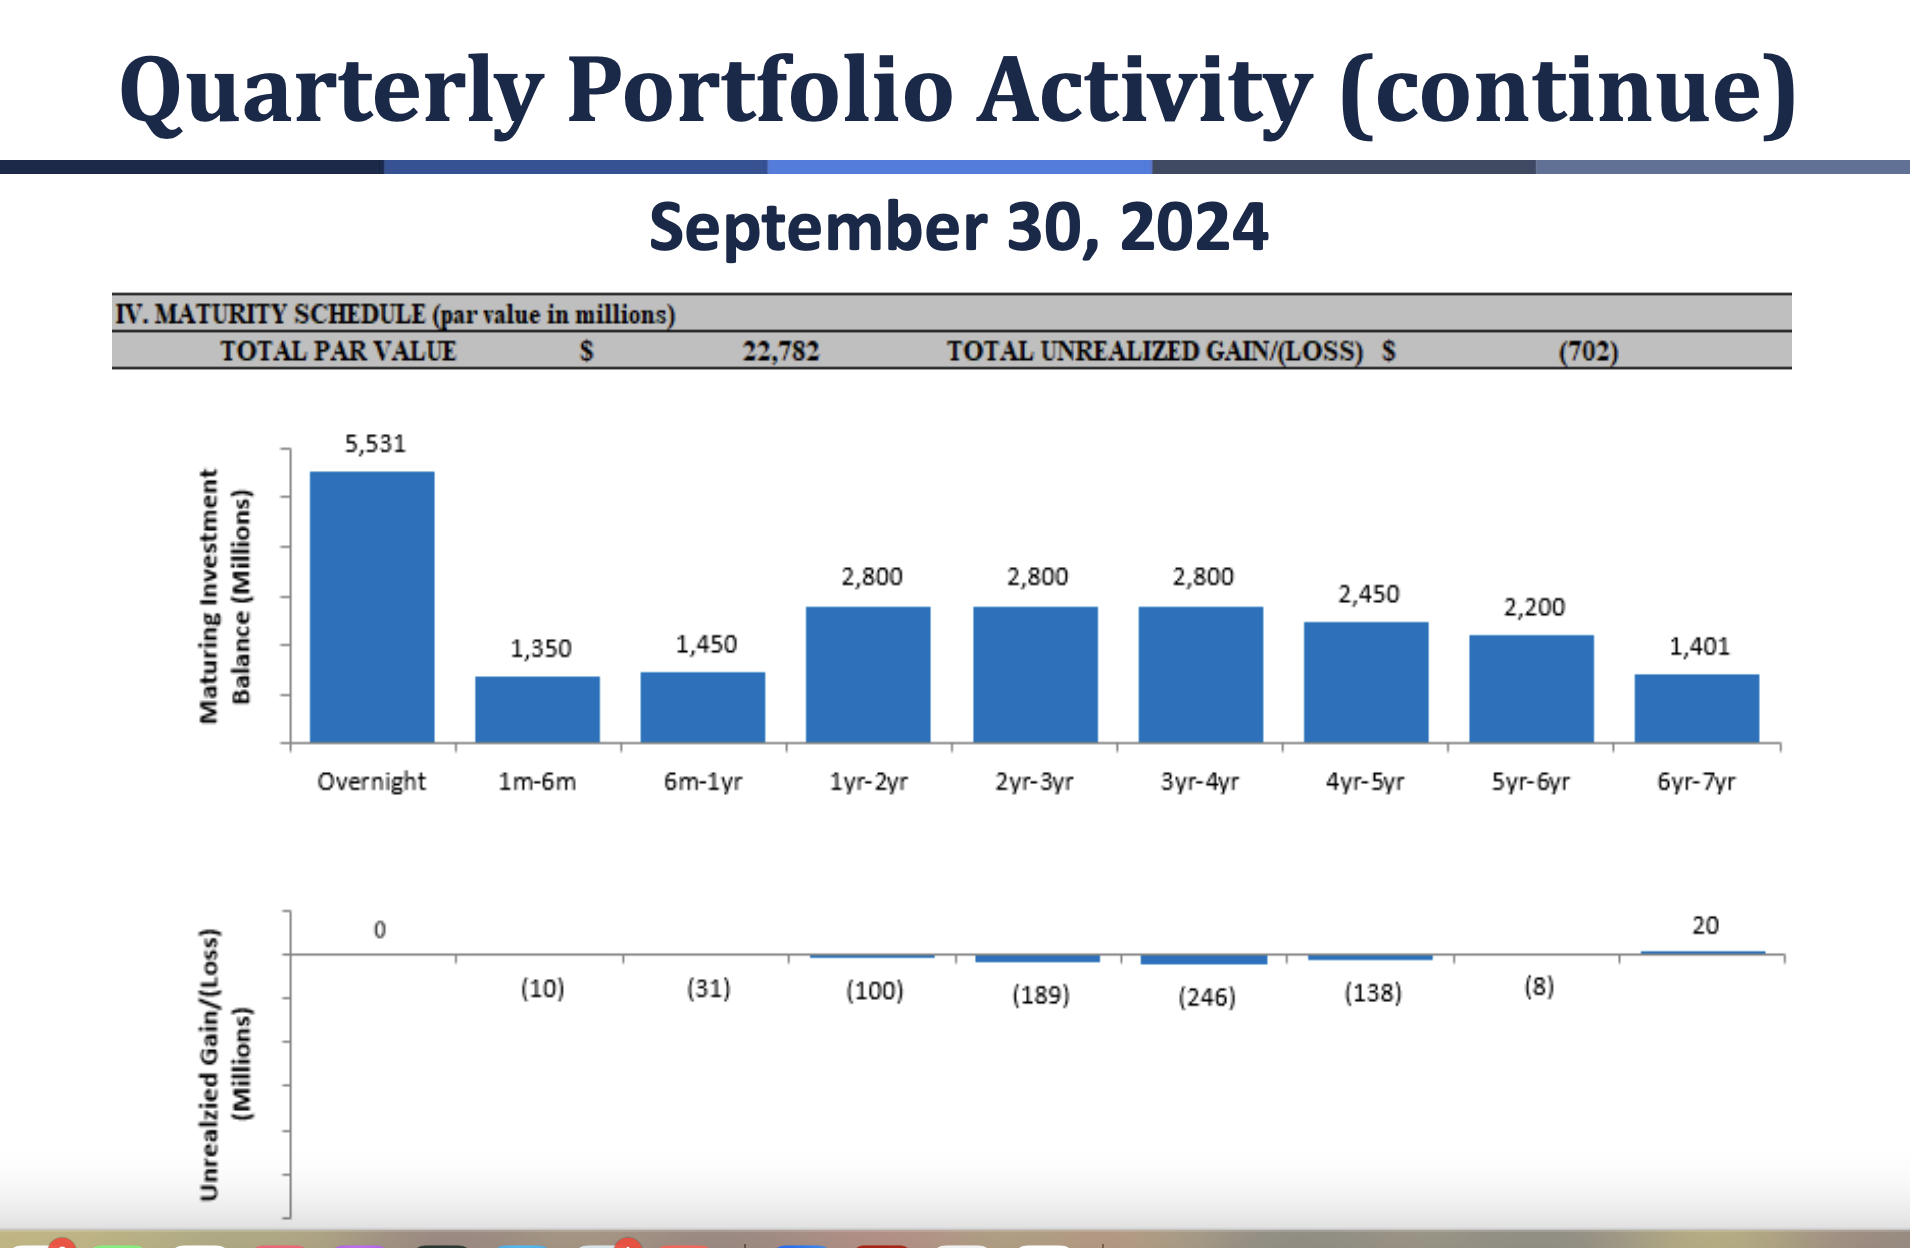
Below is the latest investment report provided to the board in the quarterly review.
It shows an overnight yield of 4.79% on 24% of the portfolio; 1.74% on the remaining 76%; and a weighted average YTD yield of only 2.48%. This below market return is due to the fixed rate bonds purchased following a robotic investment ladder out to over seven years independent of any ongoing IRR assessments.
At September 2024, every investment maturity bucket except overnights, and recent investments for seven years, are below market value.
This update shows one investment action during the third quarter: $1.1 billion of bonds purchased on August 15, 2024 at “various” yields of 3.5% to 3.85%. Following are the other yield-investment options that same day from the Department of the Treasury.
Date
8/15/2024
1 Mo
5.53
2 Mo
5.4
3 Mo
5.34
4 Mo
5.22
6 Mo
5.04
1 Yr
4.52
2 Yr
4.08
3 Yr
3.9
5 Yr
3.79
7 Yr
3.83
10 Yr
3.92
20 Yr
4.28
30 Yr
4.18
This August investment decision yields less than all other Treasury options with maturities less than three years-shown in blue. It extends the interest rate risk as measured by the fund’s weighted average life (WAL). It follows the same pattern of activity that resulted in the fund’s past three plus years of underperformance.
With the portfolio’s current WAL, this revenue-yield shortfall could extend for another 2.5 years. Have no lessons been learned from this latest interest rate cycle?
Since 2008, the fund’s data shows that a portfolio return between 2.5% and 3.0% is more than sufficient to maintain an NOL of 1.3%. Returns above that breakeven range would give credit unions a dividend to recognize their open-ended underwriting commitment. More importantly, it rewards their collective risk management.
The Fund does not need more assets relative to risk, as some board members have stated. It needs more effective management of the portfolio investments it already receives.
The Chairman of the investment committee and two of its four members were at November board table responding to questions. This would have been the perfect time for a dialogue about whether alternative investment options were considered. This one day’s investments in August increased IRR risk, reduced liquidity and returned a lower yield than multiple other options.
Instead of explaining this decision, the board continues to put its head in the sand. It glosses over performance charts that would not get past questioning by the newest examiner should a credit union report this outcome and unexamined policy.
In the meantime, credit unions are on the hook for NCUA’s mismanagement of the fund’s return, not just the industry’s potential insurance risks.
The Lack of Transparency
There are a several calculations used in the final numbers that are vital to understanding their reliability. At times in the past these assumptions and data are shown in detail at briefings. This time only a final number is given so that it is impossible to validate the results presented.
The classic example of a lack of transparency was that until February of 2024, the staff had provided its calculation of the modeling data used for recommending the normal operating level (NOL) for the fund’s coming year. This cap determines when a dividend must be paid from net income. In February however, the board continued the 1.33% with no underlying data or assumptions presented to justify a cap higher than the long time, traditional 1.30%.
That 1.30 was exactly the actual NOL reported for December 2023. The financial model was working exactly as designed, yet the staff and board just rolled over the old higher level with no factual justification. The fund’s own performance belied the need for an NOL above the historic cap.
In the prior two years of staff’s 1.33% NOL recommendation, the underlying data were provided. But when modeled out this information did not support their recommendation. Rather it showed that the historic 1.3% cap would have covered all the forecasted model’s contingencies in the next five years. Is that why no details were given for 2024’s NOL setting?
One board member commented in the Q&A for 2024’s NOL that he did not know what the right number should be. Moreover he didn’t think it would make a difference for credit unions whether the cap was 1.3% of 1.33%. As of September 30, the fund’s equity ratio was .303% and headed higher by year end. Should the December 2024 exceed 1.3% that decision will matter greatly, causing credit unions to forego tens of millions in NCUSIF dividends.
The question is not, what is the right cap on the NOL; rather, it is what is the appropriate range for the fund’s equity so that credit unions can share in the success when all goes well. That judgment is no different from managing a credit union’s capital ratio, a decision and responsibility familiar to every credit union board member and CEO.
Other Missing Details
Another disclosure shortcoming was the investment report. Instead of listing the individual investment purchases as in past reports, “various” maturities and a range of yields (3.8 to 3.85%) were given. This suggests the individual securities were for at least 7 years. This investment choice was at a time when the yield curve offered multiple higher returns on all options with maturities less than three years.
These shorter investments would reduce liquidity risk, improve yield immediately and enhance portfolio flexibility—but no board member questioned these August 15 investment decisions.
Undocumented Projections
The 2024 year end NOL projection by staff was given in a footnote as 1.28% in the last slide. In previous December year end forecasts, the staff has presented a full NOL calculation in a single slide. The data included projected retained earnings, insured share totals and the resulting NOL outcome.
Insured shares grew only .46% in the third quarter. If that growth pattern continues in Q4, then the NOL could be much higher than the 1.303 at September. Why present such an important forecast result (1.28%), which is below the current actual level with no substantiating numbers or assumptions?
Yet no board member commented on this lack of disclosure—and its implications for credit unions.
An Increase in Allowance Account and No Losses
Another critical number is the loss expense which is used to increase, or sometimes lower, the total dollars in the reserve account. For the quarter the additional expanse was $21.7 million raising the total allowance to $232 million or 1.32 basis points of September 2024 insured shares. So far in 2024 the total actual insured losses are near zero.
Th allowance ratio is greater than the NCUSIF’s average annual loss experience since 2008. In the most recent five years there have been no major losses. Yet the reserve continues to grow in both dollars and relative to insured risk.
The formula being used for this reserving should be disclosed. This expense comes right out of retained earnings and thus reduces the NOL number. Just as when presenting an NOL forecast, the underlying assumptions and data should be open for board, public, and credit union scrutiny.
The State of the Board’s Stewardship
As for Otsuka’s call out of the board’s stewardship of the NCUSIF, the examples above are some of the specific opportunities to enhance this responsibility. And we haven’t even gotten to the backward looking calculation of the NOL, but that issue is for another day.
Endnote: Brief History of NCUSIF Redesign
The new NCUSIF financial design in 1984 was based on a study of insurance alternatives and the fund’s initial 15 year trends. The traditional premium approach in the first years of the 1980’s required double premiums assessed by NCUA. But even then, the fund made no headway toward the statutory goal of 1% of insured shares.
There were two major reports of this in-depth reassessment. One was a 100 page study sent to Congress on April 15, 1983 by Chairman Callahan. The report addressed specific congressional questions, provided a history of cooperative stabilization and share insurance funds, and gave recommendations for change. It also included extensive comments from credit union leaders.
When the new design, A Better Way, was established by Congress in 1984 the background analysis for a new model was explained in the video below. It was sent to all credit unions outlining this unique collaborative effort and its benefits for credit unions. For without the credit union support, there would have been no congressional action to authorize this unique cooperative approach to NCUA’s share insurance model.
I missed the November 21 NCUA board’s NCUSIF update so went back and listened to the 30 minute discussion via video. The report was incredibly positive. About both the financial performance of the fund and credit union industry trends.
There were several data “blanks” and areas that were not covered that I will discuss tomorrow.
The slides used to update the NCUSIF can be found here. YTD net is over $226 million which raised the Fund’s total retained earnings to $5.4 billion. This is .3033% of total insured shares ($1.767 trillion) at September 30, thus exceeding the .30% historical NOL cap.
Total insured losses for the year are negative, that is, recoveries of $2.0 million on prior losses have offset current writedowns of just $1.1 million. Nonetheless, NCUA has increased the loss allowance reserve to $232 million, or 1.3 basis points of insured shares in addition to the .3033 in retained earnings.
Since 2014 the NCUSIF has recorded actual net cash losses that exceeded 1 basis point of insured shares in only one year, 2018. That year the Fund wrote down the value of its portfolio of taxi medallion loans. In 2020 it sold this portfolio to a New York distressed asset fund manager (Marblegate) which benefitted from the full recovery in portfolio value as credit unions took all the write downs via the NCUSIF.
The CAMEL Trends
Even the CAMEL trends are positive. Kelly Lay Director of Examination and Supervision was at the table. The % of credit union assets classified as Code 4 & 5 declined from the June quarter. When asked about the change, Lay said it was because of improvements in specific credit union’s liquidity positions-a trend validated in Callahan’s third quarter TrendWatch analysis presented on November 12, 2024, nine days prior to the board meeting.
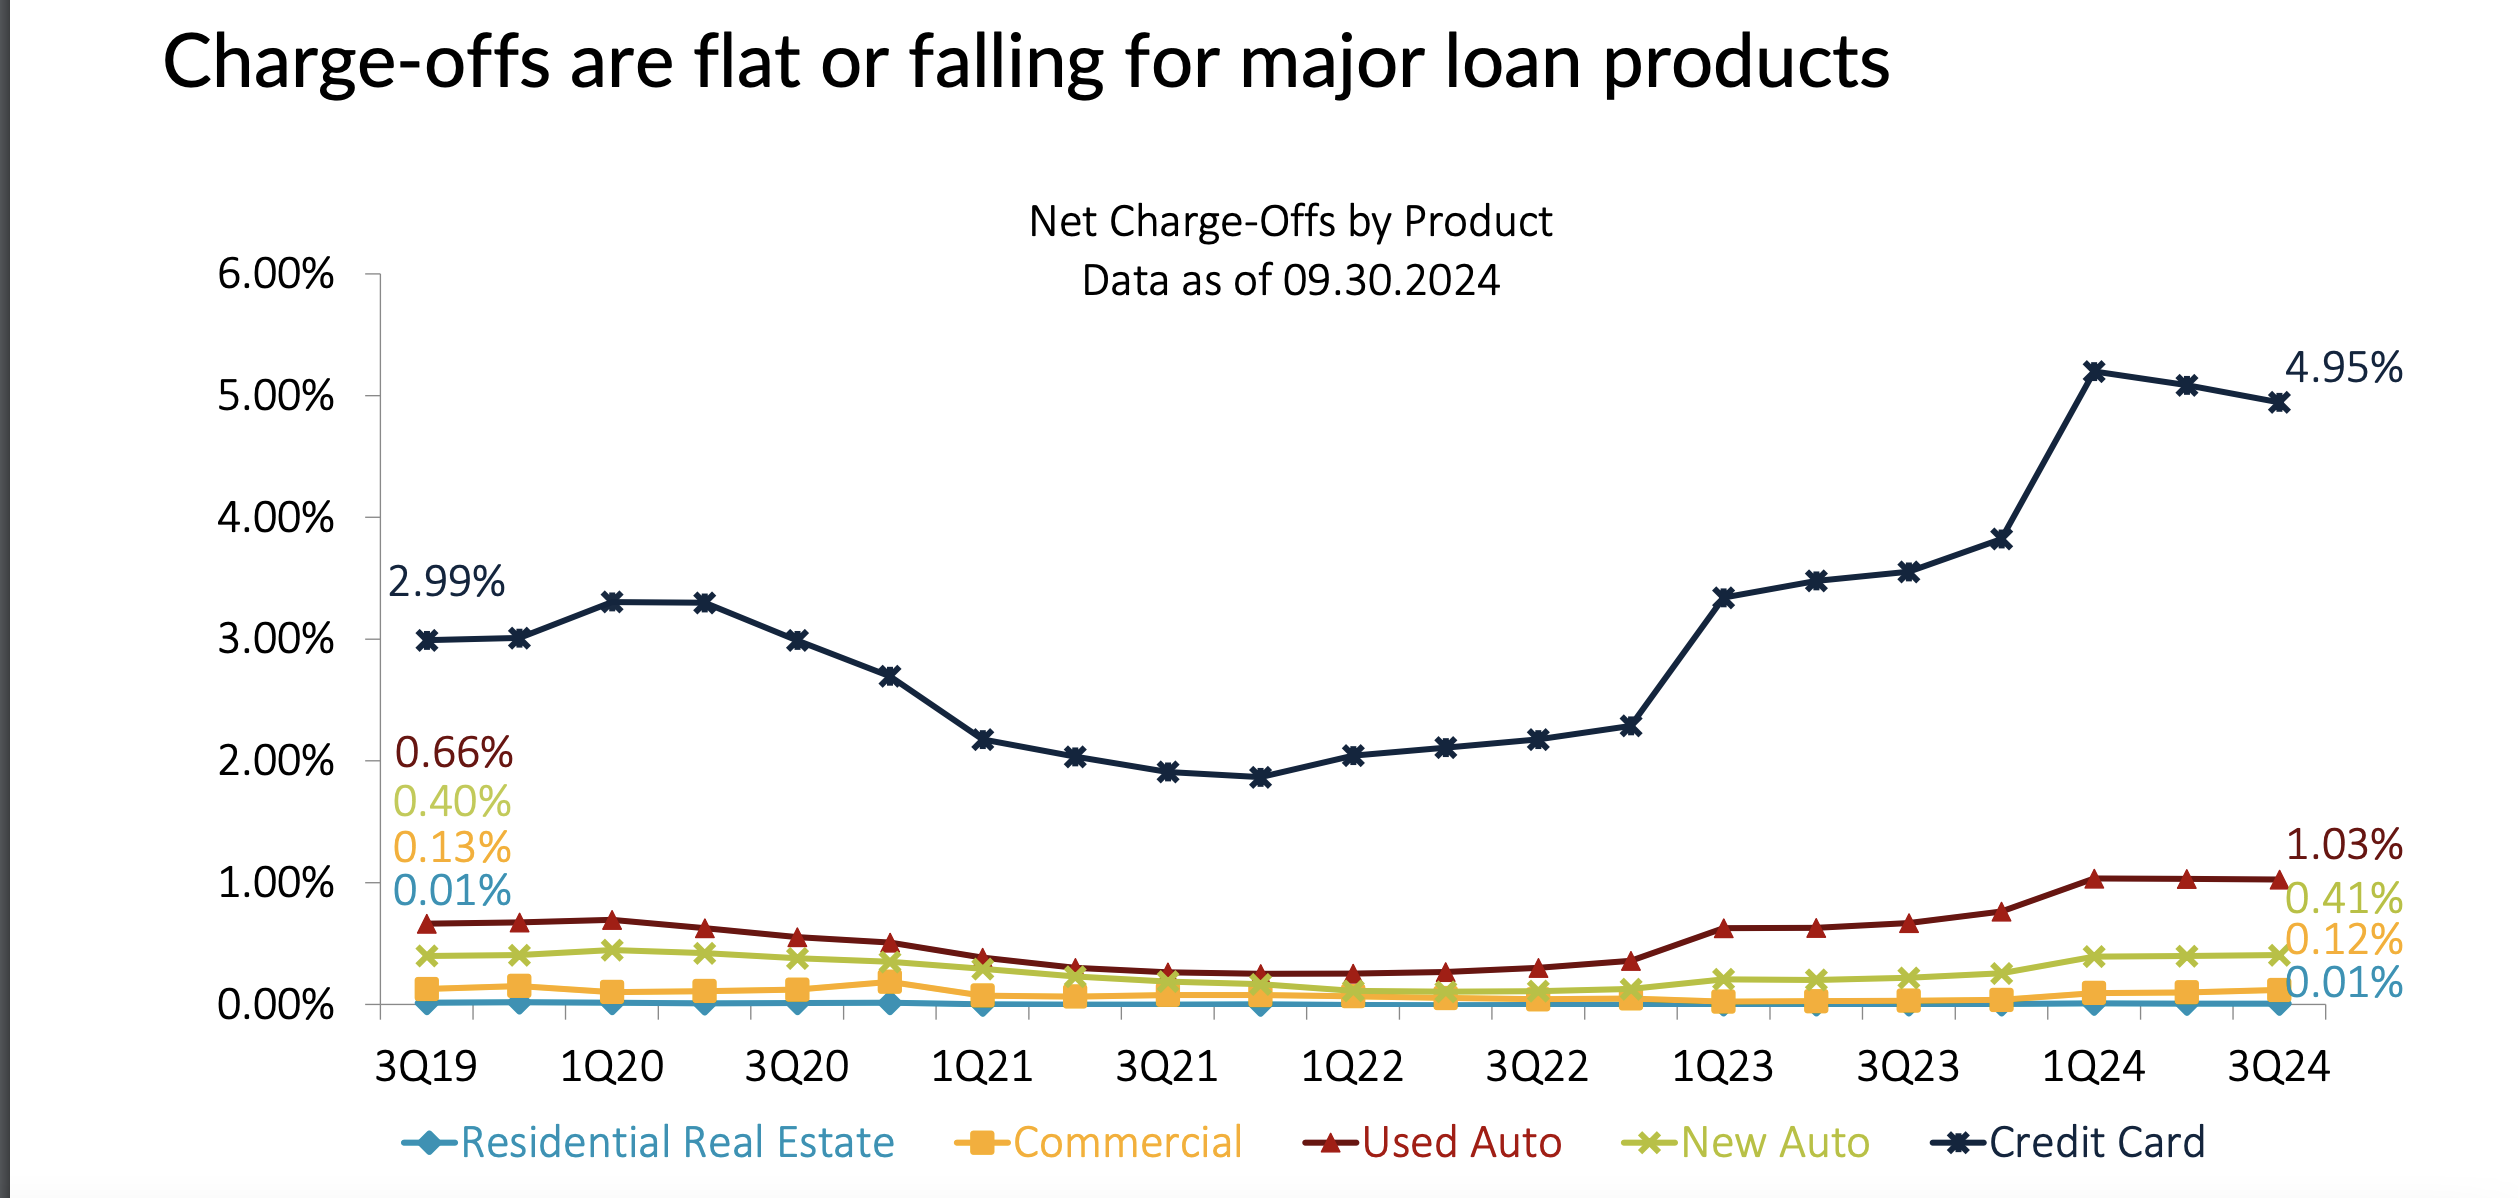
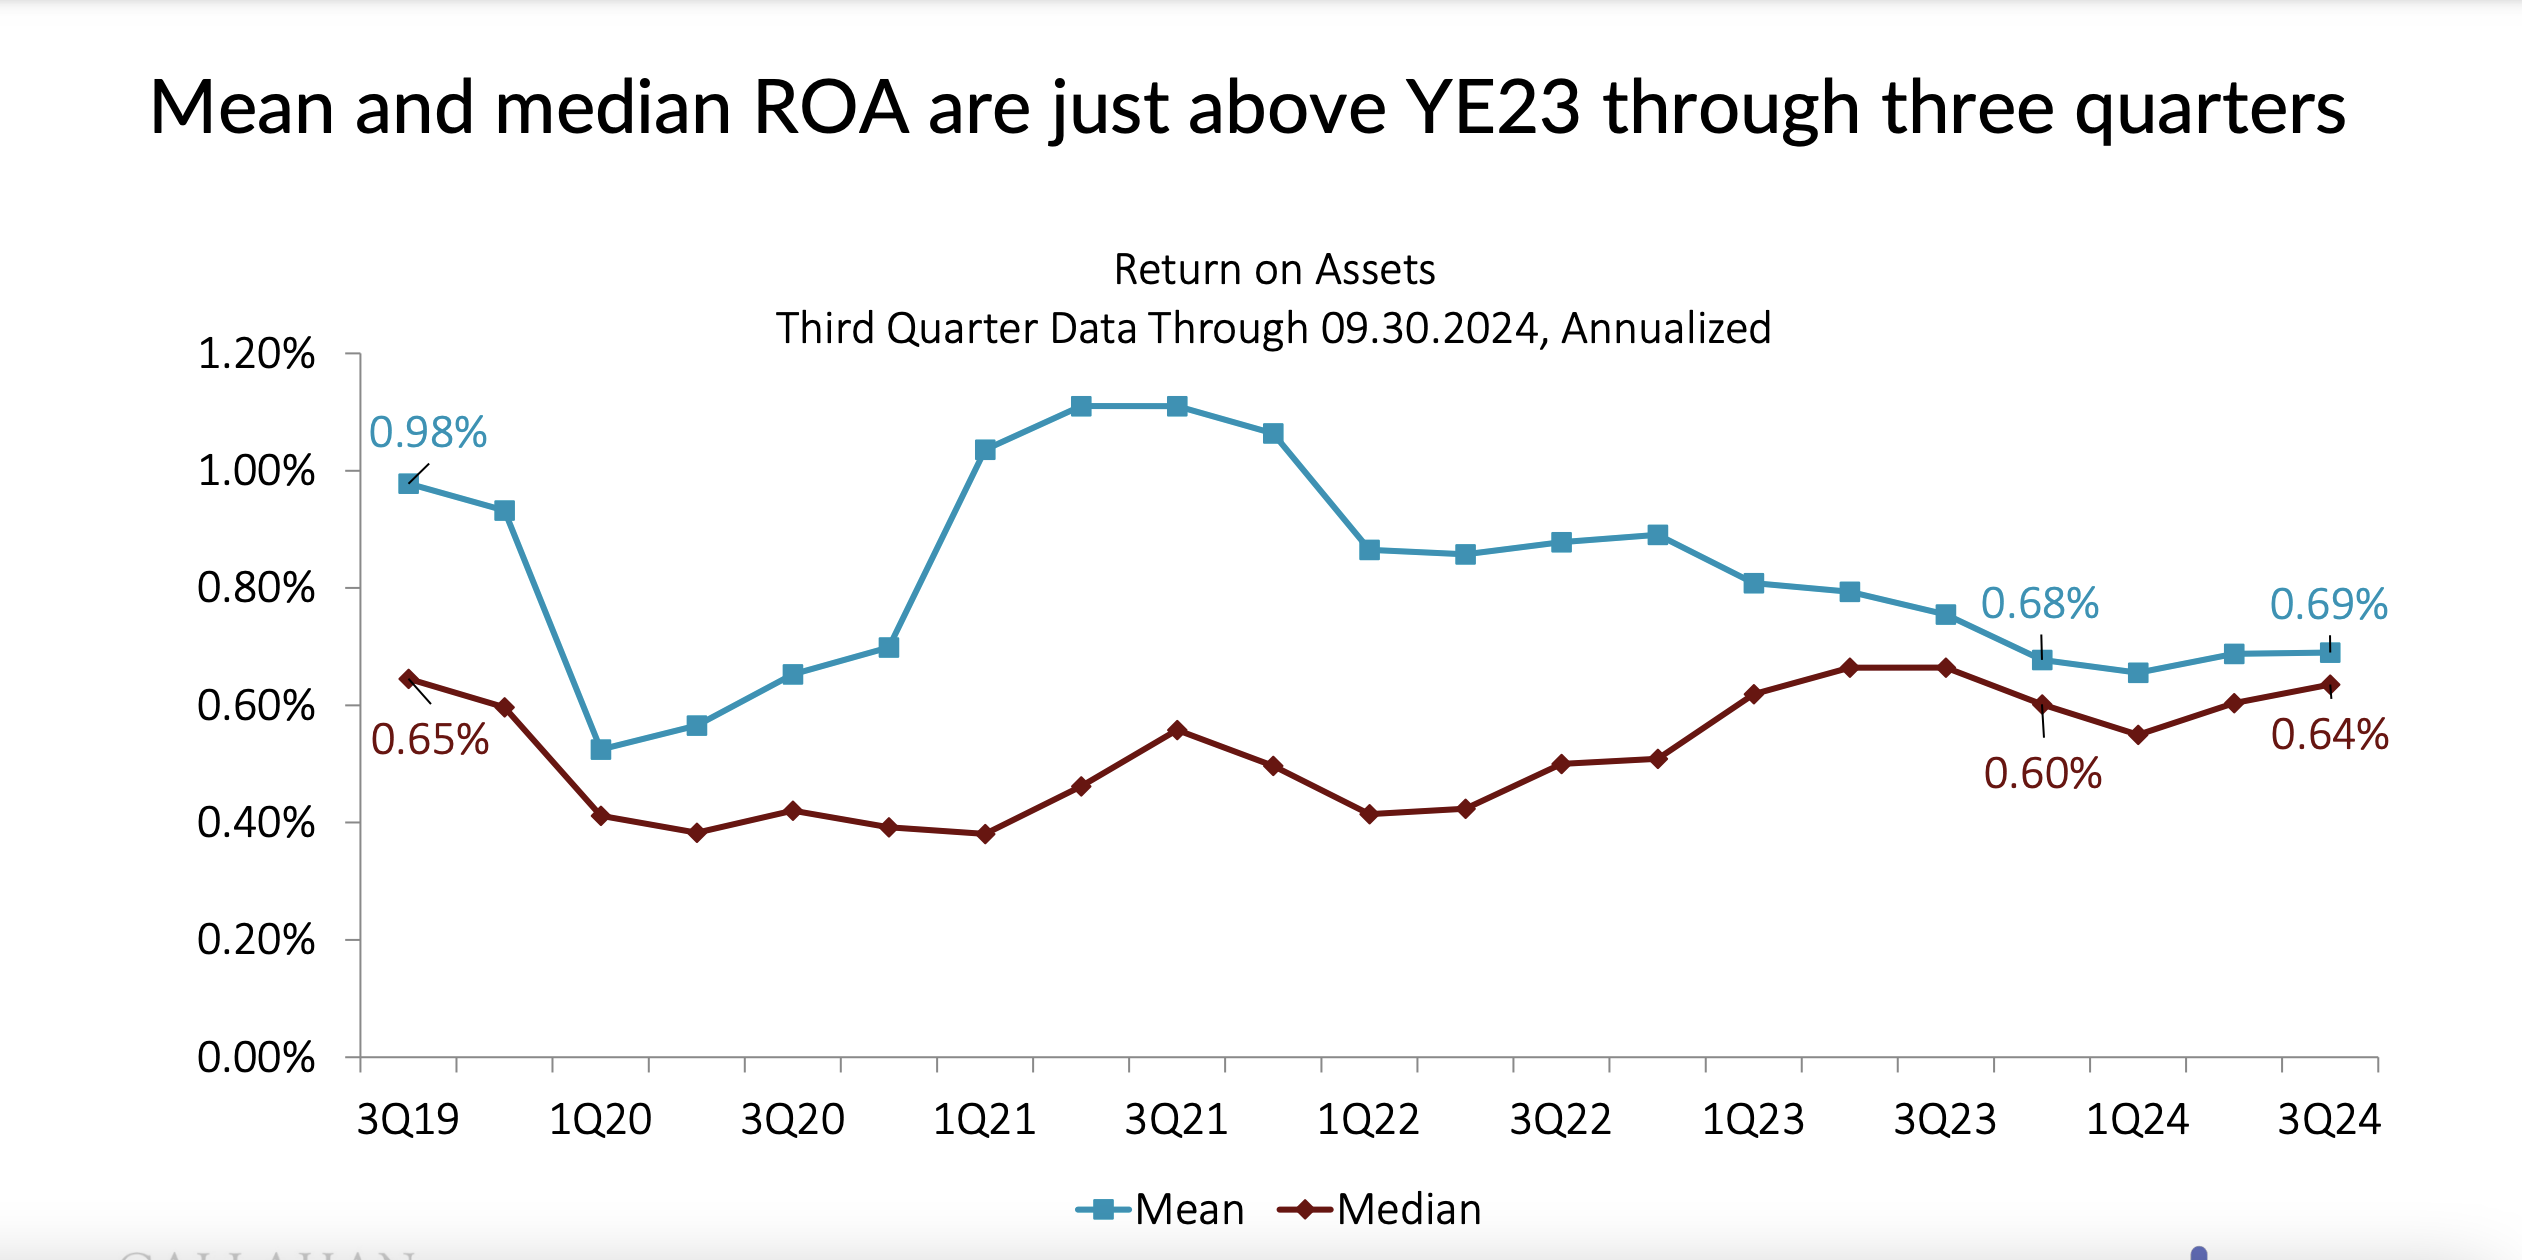
These two slides from that presentation show these changes in system liquidity:
She further stated that any large credit union that is downgraded in rating or with a 4/5 CAMEL ratings is examined at least annually. When pressed by a board member about potential exposure in commercial real estate loans, she replied that “there was nothing very concerning.”
External Third Quarter Data Analysis Positive
Several times board members referred to second quarter data, one citing an increase in delinquency and lower ROA at June 2024.
However both the macro-analysis in Callahan’s 3Q Trend Watch Video and the large, individual credit union performance comparisons by Jim DuPlessis of Credit Union Times all show marked improvement in the third quarter.
Two excellent data analysis by Jim DuPlessis include graphs that do not support this observation from older data:
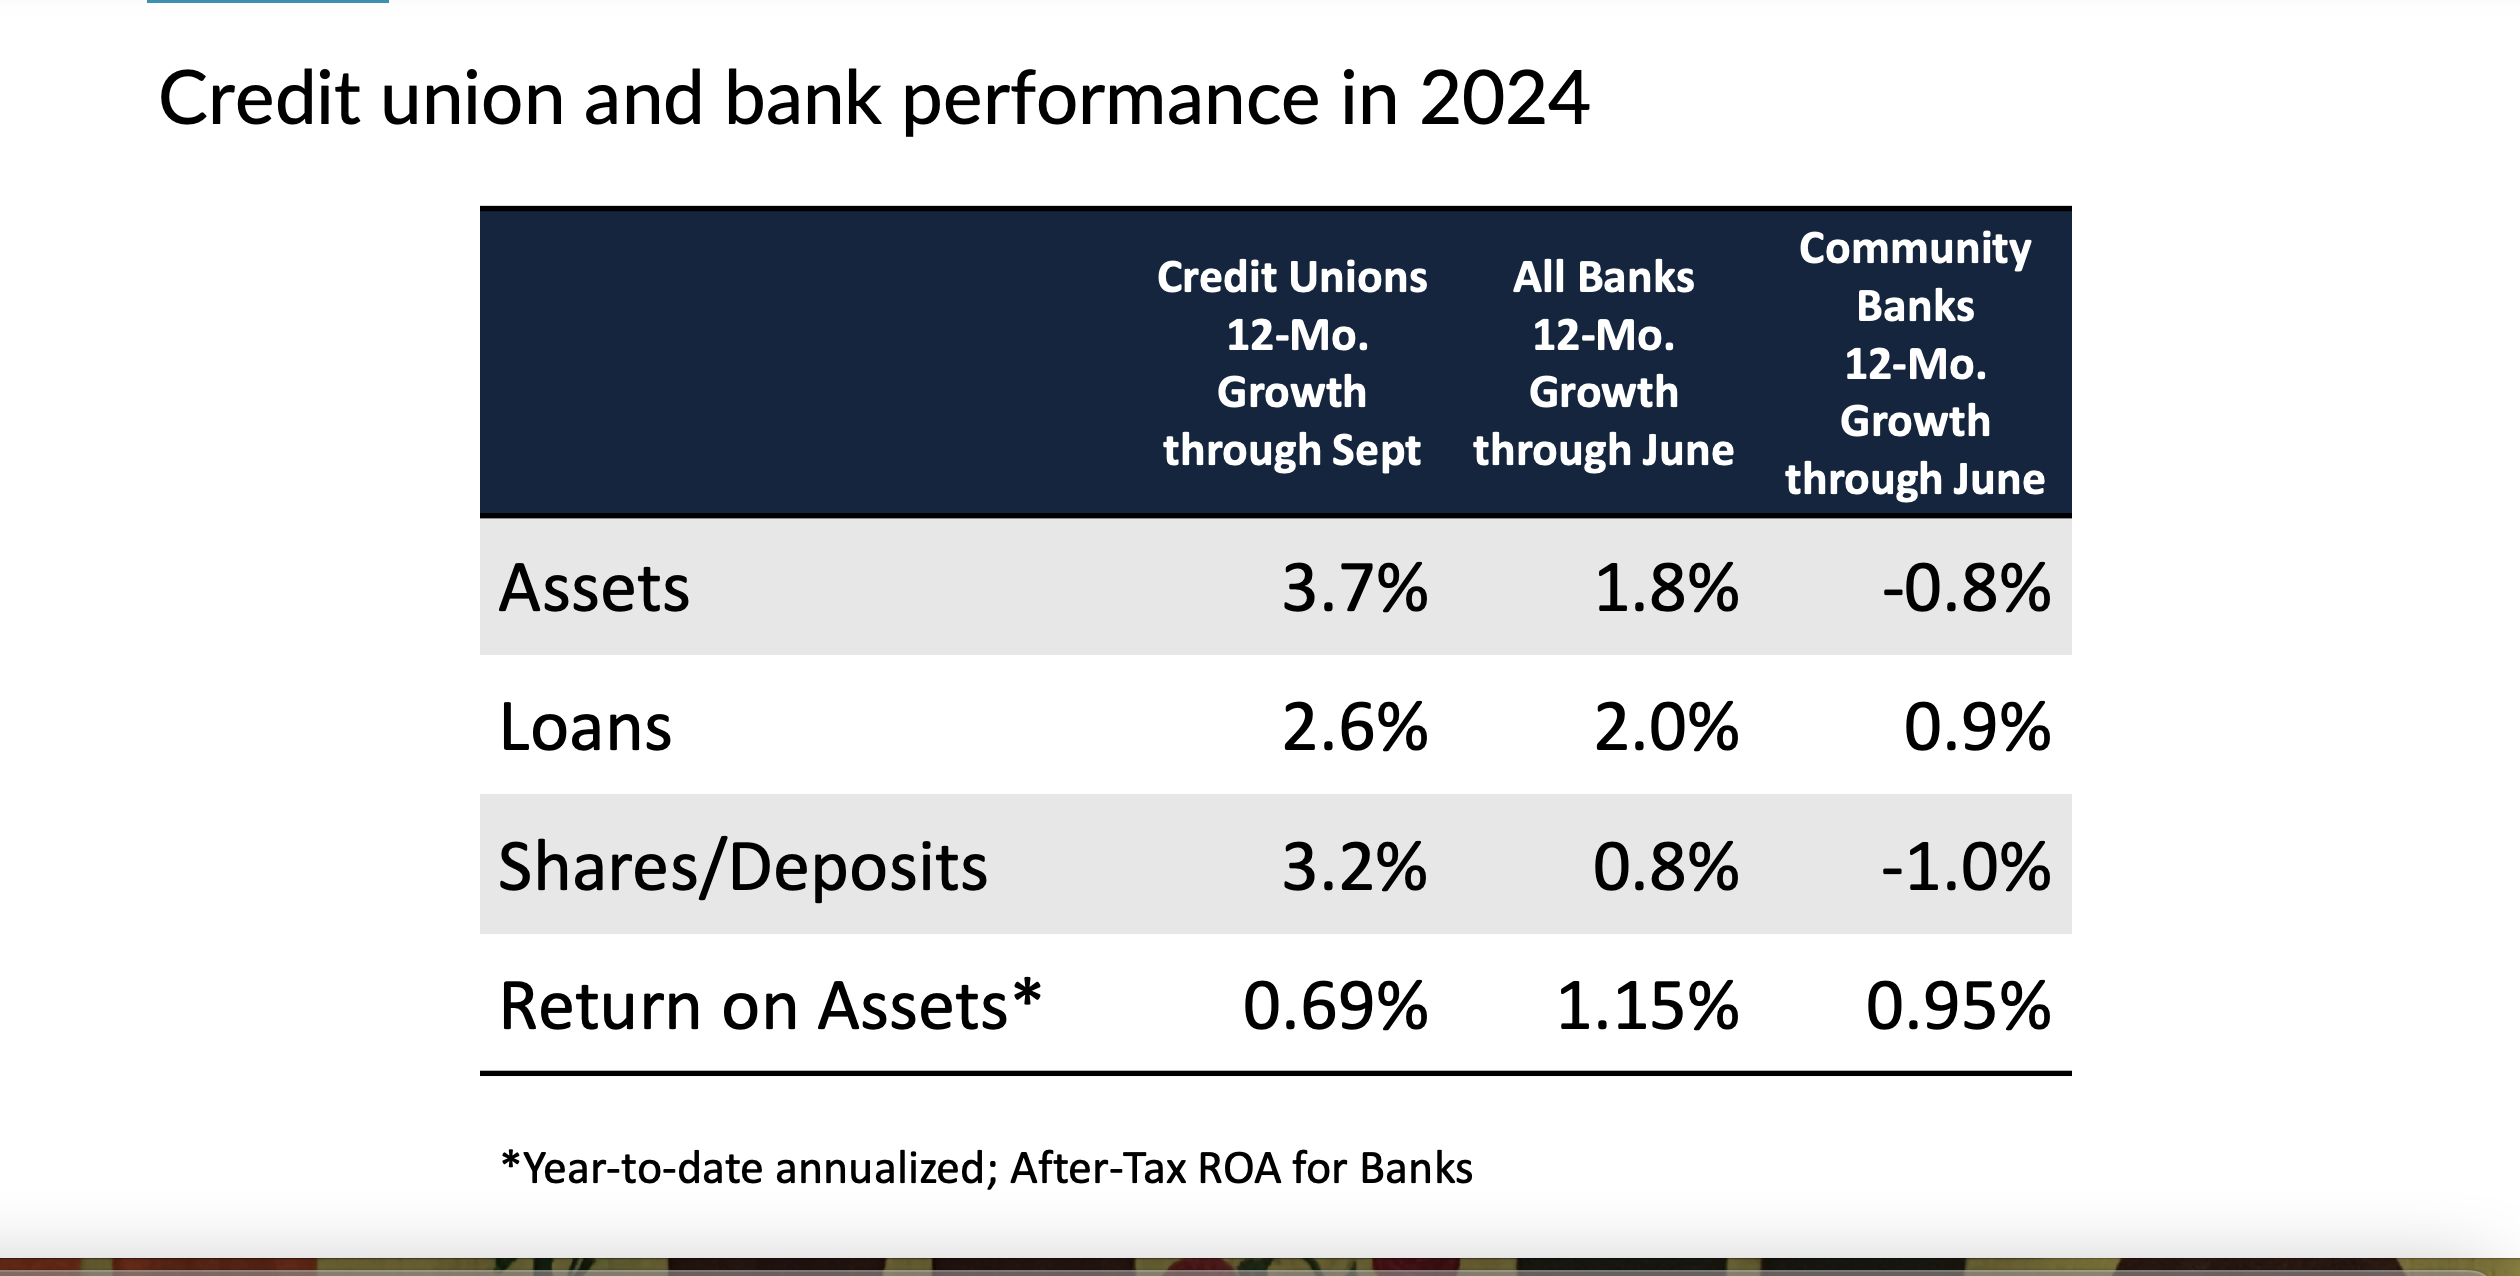
And if the macro trends in credit unions was not convincing by itself, the final TrendWatch slide showed this perfpr,amce comparison with competitors thru June as later data is not yet released:
Stewards of the NCUSIF
In her opening statement board member Otsuka commented: Being stewards of the National Credit Union Share Insurance Fund is one of NCUA’s primary jobs—a critical component of our duty to protect members’ shares at credit unions. Thus, I continue to be encouraged by the strong performance of the Share Insurance Fund.
Tomorrow I will cover areas where the data was lacking compared to prior updates and the one primary performance topic that the board failed to address.
In future updates, the presentations could be improved if more timely data were used, so the board members have the benefit of the latest information when asking questions or making comments. Or even when testifying before Congressional committees.