The NCUSIF’s redesign culminating in the October 1984 NCUA board implementation was revolutionary. This two-minute excerpt is from NCUA’s Video Network of that historical vote:
NCUA Bd Mtg Approves NCUSIF Redesign: A Better Way .
A Partnership
Board member PA Mack summarizes his approval saying: I’m ready to support this and think it is an outstanding product as a partnership among government and credit unions.”
NCUA wanted credit unions as partners, with mutual give and take, and together the cooperative system created the most successful federal insurance program ever.
Can Work Beautifully
When approved by a 3-0 vote, Chairman Ed Callahan congratulated everyone for their efforts and commented: “This is a very significant thing for credit unions. This system can work beautifully for credit unions in the future. I think the real challenge goes to you people in NCUA now. The real secret is in the operations.”
Callahan believed the power of NCSIF’s redesign was that it clearly invites credit unions into “cooperation” now and as long as the system’s integrity is preserved though proper management.
A Three-Year Process
This redesign did not happen overnight. It emerged due to the failure of the premium based approach modeled after the FDIC and FSLIC funds founded four decades earlier. This reassessment was documented in a 120 page report NCUA sent to Congress in April 1983. It featured comments from all segments of the credit union system. Legislation was drafted with credit unions and sent to Congress in 1984.
NCUA actively encouraged credit unions to support the legislative change. An NCUA video outlined the plan including the NCUSIF’s financial history since 1971-1984. This analysis was the foundation for creating A Better Way.
In the 1985, NCUA reported the outcome for credit unions following the first year of this new design:
Dividend of 5%: Because of the fund’s performance . . . for the first time ever the NCUSIF paid a dividend which represents about $30 million in equity distribution. . . The NCUSIF has returned in some form almost $270 million to credit unions: the $84 million equity distribution (when calculating the 1% deposit), the insurance premium waiver for last year, the $30 million dividend and leading into the next year, a $90 million premium waiver. (Source: Page 5 NCUSIF 1985 Annual Report)
The partnership approach based on transparent communication with credit unions and immediate return created another system benefit. The radical restructuring proved to be the way to something more– an action that renewed the entire system’s hope during deregulation and that credit unions still benefit from today.
The Operations of the Fund
The critical aspect of the NCUSIF’s cooperative design, as noted by Chairman Callahan, is how he fund is managed by NCUA staff. These four primary responsibilities include:
- The regular, timely and accurate reporting of the fund’s financial position.
- Prudent oversight of NCUA’s operating expenses charged to the fund.
- The careful management of fund losses to ensure the least possible cost resolution for problems.
- Intelligent and professional management of the fund’s primary revenue source- the yield on its investment portfolio.
In the aftermath of the 2008-2009 financial crisis a material change occurred in NCUA’s management of each of these responsibilities—all contributing to an increasingly confusing and misleading presentation of the fund’s financial status.
Today I will focus on the 2010 change from private GAAP accounting to Federal GAAP. Future posts will discuss the remaining three responsibilities.
The Ill-suited Change to Federal GAAP Presentation
From 1982 through 2009, the NCUSIF financials were audited and presented following private GAAP accounting standards. This was a critical part of the NCUA commitment to follow the same reporting and presentation standards it required credit unions to implement.
Credit unions had agreed to the perpetual 1% underwriting of their NCUSIF deposit. In return the NCUA guaranteed the information to properly monitor the agency’s management of these ever- growing 1% deposit assets.
This private accounting standards in 1982 was a departure from the NCUA’s initial practice of relying on a GAO audit which was often late in completion and did not follow GAAP accounting practices.
Why Reliance on Federal GAAP is Inappropriate and Misleads Credit Union Owners and the General Public.
Federal GAAP reporting was intended for use by entities that receive appropriations from the government. The NCUSIF receives no government funding. The unique cooperatively designed fund relies on withdraw-able member deposits as the principal underwriting source, not an insurance premium expense levied on credit unions.
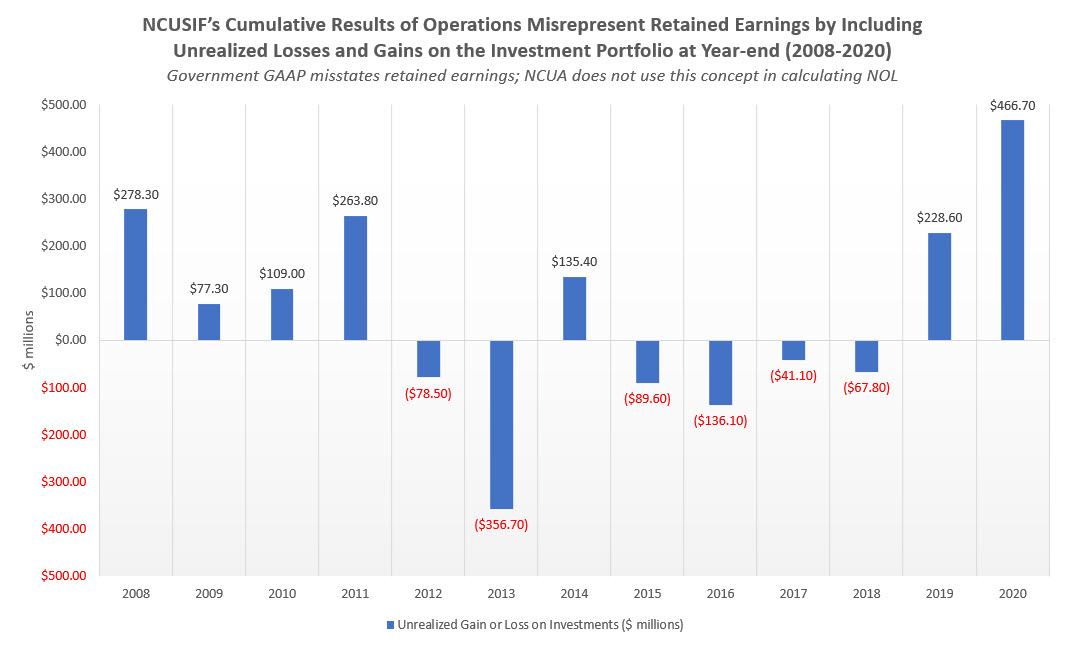
In Federal presentation the normal balance sheet categories are divided into Intra-governmental accounts and Public accounts, a confusing description at best. Liabilities have the same misleading divisions. The Net Position contains a federally defined Cumulative Results of Operations, sometimes mischaracterized as retained earnings. However in federal GAAP this account includes changes in the net unrealized gains and losses on the NCUSIF’s investment portfolio during the year.
Private GAAP does not include this. As a result the monthly income and yearly audited statements present a completely misleading number from a retained earnings or equity perspective.
The traditional income and expense information is renamed as Statement of Net Cost.” This presentation is similarly as confusing and misleading as the balance sheet categories. The presentation begins with Gross Costs , followed by Less Exchange Revenues, with a so called bottom line labelled, Net Cost of Operations.
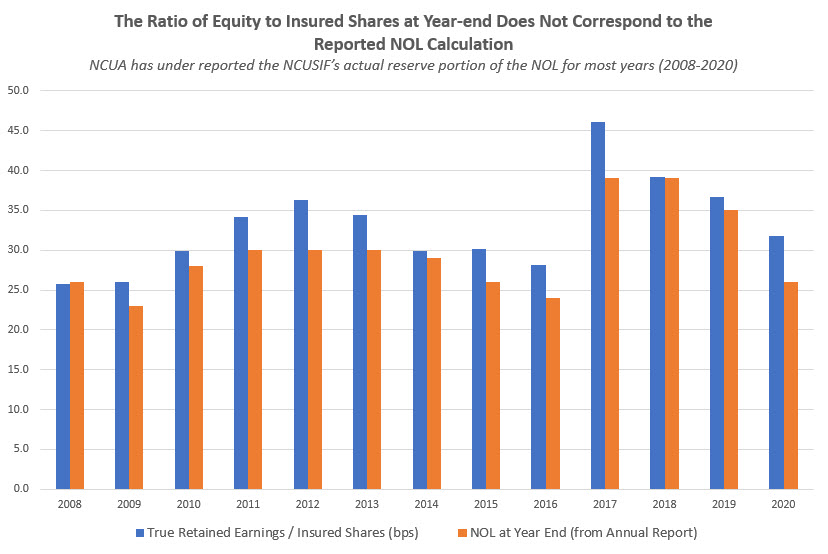
In 2020, Federal GAAP reported an NCUSIF bottom line of a $239 million gain; however private GAAP net income was only $32.9 million. The outcome is that actual retained earnings do not correspond to cumulative results of operations, thus misstating the true NOL when the 1% deposits are added. This annual over or under presentation of “fund equity ” is shown in the following chart.
Federal government accounting reporting does not appropriately present the fund’s “equity” at yearend
This confusing presentation continues in the other required financial statements. These include the federally prescribed Changes in Net Position and the Statements of Budgetary Resources. Neither portrays the data needed to understand traditional financial concepts of changes in cash flows, retained earnings or total equity. These concepts were created for federally appropriated entities.
To see the full 2020 audit report following Federal GAAP presentation, click here. Pages 13 and 14 are completely unintelligible versus private GAAP presentation.
The standard Federal GAAP presentation is so confusing that when staff updates the NCUSIF financial results to the board, the income statement and balance sheet are converted to the standard GAAP income and balance sheet formats.
However even this monthly “translated” accounting practice is a mash up of private and federal GAAP concepts. For example the most recent NCUSIF update showed a quarterly net income at September 30 of $58.6 million. The balance sheet account which would include this gain is called the Cumulative Results of Operations. That account instead shows a quarterly “loss” for the September quarter of $16 million. This $75 million total difference is due to the net decline in market valuation of the investment portfolio.
Two Different NOL Calculations in the Audit
These distortions continue even when NCUA calculates the formal audited NOL ratio at yearend. In the 2020 audit footnote 13 states the NOL is 1.26%. This number is calculated by dividing the total Net Position of $18.9 billion by yearend insured shares of $1.5 trillion.
However in the same audited statement NCUA presents a different way to calculate the NOL and whether a dividend is due credit unions:
The NCUSIF equity ratio is calculated as the ratio of contributed capital plus cumulative results of operations, excluding the net cumulative unrealized gains and losses on investments, to the aggregate amount of the insured shares of all insured credit unions. (pg 134 NCUA annual audit for NCUSIF, emphasis added)
Subtracting the net gain of $511 million NCUSIF net investments at 12/20 from cumulative results of operations gives and NOL, per the above paragraph, of 1.228 or 1.23%. Which number are credit unions to believe? Which NOL calculation determines the dividend?
Why Readopting Private GAAP is Critical
The confusions and misleading calculations shown above are just some of deviations from private GAAP accounting financial presentation and audit scope.
Moreover the misrepresentation even extends to how the 1% required credit union deposit true-up is included in the yearend NOL calculation.
The recognition of the 1% required capital true up was a settled financial practice until the board chose to change this in 2001. Today that change continues to distort the true NOL.
For example the traditional method for NOL calculation followed from 1984 through 2000 would result in an NOL of 1.32% at 2020 yearend. ( a retained earnings ratio of .32 plus 1%) This is much higher than either of NCUA’s two reported calculation methods in the NCUSIF audit.
This underreporting misrepresents the NCUSIF’s actual financial strength and would deny credit unions a dividend if the historical NOL cap of 1.3% had been in place.
For users of the NCUSIF financial statements, Federal GAAP is confusing and misleading. The NCUA in fact continues to use private GAAP in all three of its other fund annual audits and monthly presentations.
“Fairly presenting” the NCUSIF results for credit unions requires a return to an accounting system which credit unions can understand so they can monitor their investment in the fund.
Tomorrow I will look at how NCUA has changed the way it charges the NCUSIF for its operating expenses. And the consequences on the fund’s financial performance.