NCUA’s 2021 Year End Forecast for Credit Unions

At the September Board meeting, CFO Eugene Schied presented the forecast for the NCUSIF’s year end NOL.   The ratio he gave was 1.28%.    The slide showed the outcome  and the formula, but not the numbers used to calculate the ratio.

NCUA’s public affairs officer Joseph Adamoli has provided that data.

Large Slowdown in Share Growth Last Six months of 2021

NCUA staff projected yearend insured shares totaling  $ 1.597 trillion.  This would be an 8.8% growth from 2020’s yearend total of $1.468 trillion.

Since we know the midyear insured shares were $1.580 trillion, this indicates NCUA believes credit unions will add just $17 billion more in the second half of the year.

The 2020 yearend share growth was 20.9%;  the 12-month growth at June 30, 2921 was 15.4%.    Therefor NCUA foresees a significant decline in new deposits from these actual double digit  trends.

Net Income for the NCUSIF

The yearend retained earnings are estimated to be  $ 4.701 billion which would be a decline from the NCUSIF’s  July report of $4.739 billion.   In other words, NCUA projects an operating loss for the final five months of approximately $38 million versus a positive net income through July of $118 million.

There was no information to explain the decline in net income. Since monthly investment income more than covers all operating expenses, the agency must be projecting an increase in  the insurance loss expense.

2021 NCUSIF Equity Ratio

NCUA’s two yearend forecasts of $4.7 billion of retained earnings and insured shares of $1.597 trillion, results in the fund’s equity ratio of .294%, or almost at the 1.3% historical NOL level.

This forecast shows the importance of the NOL cap.  For if retained earnings exceed the NOL, then any overage must be paid in dividends to credit unions.

If instead of negative net income for the final five months, the NCUSIF were to report a gain of just $52.8 million, the equity ratio would be right at .3%.   Even that result would be less than half the net reported in the first seven months.

Transparency and Responsibility

No matter how close NCUA’s estimates prove to be, the first conclusion is that this will be a good year for the NCUSIF, even if share growth ends up higher than the forecasted 8.8%.

The estimates also demonstrate the importance of resetting the NOL based on actual historical performance versus hypothetical scenarios with no objective validation.

We don’t know if there will be an NCUSIF update during today’s Board meeting.   If there is, the credit union owners have the data necessary to track performance which is one of credit union’s most important responsibilities.

For if the owners and contributors of the 1% perpetual underwriting show little interest in the NCUSIF’s performance, the prospect of a dividend or effective use of the fund’s investments, then the  accountability for oversight built into this unique  co-op model will break down.

The transparency from NCUA is helpful, but only if credit unions use it to monitor the fund and provide comments  to the board.   For the next big NCUSIF decision will be setting a new NOL level (currently 1.38) at one of the two monthly board meetings remaining this year.


What Can We Learn from the Oldest FCUs?

An S&P 500 company was projected to last for more than 60 years in the last half of the 20th century. Today that lifespan is down to  18 or fewer years.

Many believe this shortening  of business’ existence is  merely the accelerated playing out of economist Schumpeter’s theory of creative destruction, i.e. the free market at work.

However there is another way of looking at business sustainability by asking which are the oldest business still operating today.  What can their stories tell us versus the inexorable extinction  that seems to be the market’s dominate outcome?

Several articles trace the origins of these Methuselah-like firms that have existed for centuries.  Their commonality is that they provide products or services that people always need: wine making or breweries, inns and hotels, weaponry/foundries and mints,  and personal services such as Shore Porters or an Istanbul Turkish bath.

The Oldest Federal Credit Unions

NCUA’s June spread sheet of all 5,032 federally insured credit unions gives everyone the chance to analyze FCU charters by longevity.  The latest financial performance information is laid out in charter number order. Starting with charter #1 Morris Shepard Texarkana to # 24,927 Credit Union of New Jersey, a conversion from a state charter founded in 1943.

While some FCU’s conversions from states are much older than their indicated by their fed charter order, the vast majority listed through the early 1980’s are an accurate indication of institutional longevity.

While most credit union adherents know the first charter was from a state, St Mary’s Bank in 1909, the evolution of the federal charter is less documented.

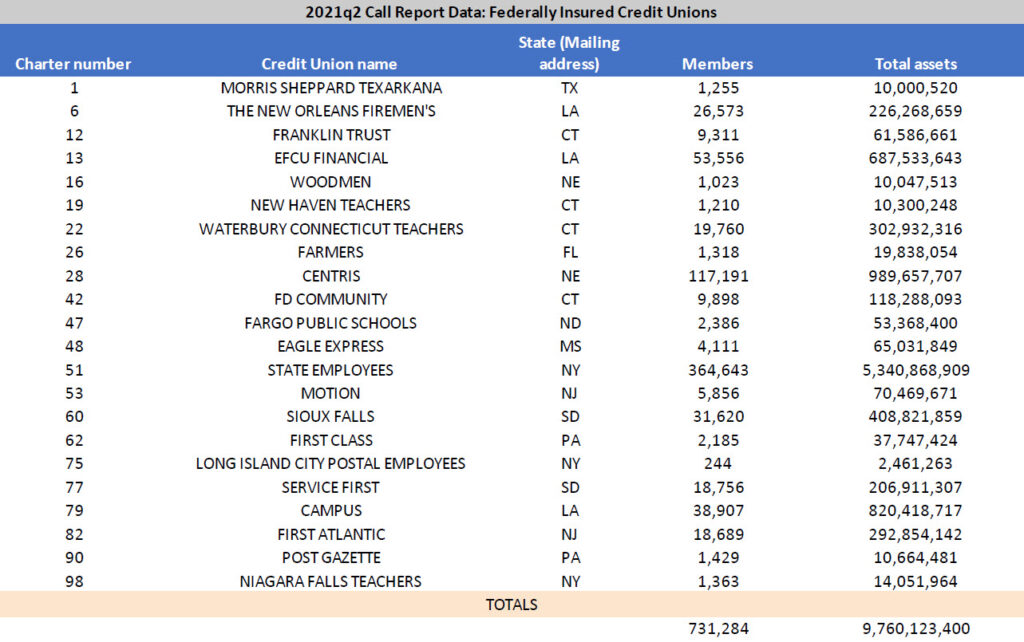
Of the initial 100 charters granted by NCUA, 22 are still active. These are listed below.

These initial charters were granted in 1934/5 during the Great Depression, immediately following passage of the 1934 Federal Credit Union Act. These startups have persevered through nine decades of economic cycles, WWII, financial deregulation, competitive reconfigurations, and technology changes unimaginable by their founders.

Their survival rate, 22%, is almost double that of all FCU’s which is 12.6% (3,146 active charters and 24,927 issued). What can we learn from these long- serving charters? How can their stories provide insight for today’s credit unions? Is there a reason they have twice the sustainability as FCU’s generally?

Initial Observations on Sustainability

I am not familiar with any of these credit unions, however reviewing the data here are some initial thoughts along with questions that might be interesting to  pursue.

The 22 are diverse in size, number of members and geographic location. From $2.4 million to $5.3 billion in assets, they demonstrate the diversity and flexibility of the coop charter.   It serves all institutional sizes, towns and cities and geographic regions.

Of the eleven states where these credit unions operate, four are in Connecticut. Why? Was there not a state charter option, and therefore the initial credit unions were all federal?

Many of these initial charters served persons working in the public sector: firemen, postal workers, teachers, state employees and a university. Even Morris Shepard, charter #1, initially served the city employees of Texarkana. These public sector sponsors still exist and in many cases have expanded.

Is the relative stability of their public employment a key to credit union sustainability? For example, Long Island Postal Employees reports only 244 members and $2.5 million in assets. But it is still supported by these  members with an office in the basement of the Post Office.

Credit Union History Still Present For Us

Understanding credit union history is about more than honoring longevity. Their experiences can be instructive for present day prognosticators.

Cooperative design is intended to be perpetual.   Privately owned firms rarely transition beyond their initial founders.  Public companies including banks can be bought and sold in the open market at any time.

Coop capital is paid forward to benefit future members.  While every credit union is subject to the forces of a competitive market, outright failures are rare.

However there are a number of seers who routinely offer their view that coop design is not sufficient for longevity.  In their foretelling what is required  is size (scale), the latest technology and  “innovative” strategies which emulate their competitors.

While several of these long-timers might validate these tactics, most do not.   Rather the common factor that seems to sustain is what created the credit union in the first place:  the  service to and loyalty from the members.   Morris Shepard FCU’s origin statement on their website says it  clearly:

As a member-owned, not-for-profit financial cooperative, Morris Sheppard Texarkana FCU will continue to uphold its fundamental responsibility to actively serve people within our field of membership, which consists of the employees of the City of Texarkana TX, City of Texarkana AR, Bowie County and their spouse, children, and grandchildren. We will continue to deliver a range of low cost products and services to the diverse economic and social makeup of our members and potential members.

They continue to celebrate their first in the country creation:

Our History

Morris Sheppard Texarkana Federal Credit Union was named in honor of U.S. Senator Morris Sheppard, who represented Texas in the Senate from 1913 to 1941 and was one of the credit union movement’s greatest supporters in Congress. Senator Sheppard drafted several pieces of credit union legislation in the early 1930’s. But it wasn’t until 1934 that the passage of a Federal Credit Union bill appeared likely, thanks to the efforts of Sen. Sheppard and another Texan who had become convinced of the bill’s importance, Congressman Wright Patman. Our local credit union chapter, an affiliation of credit unions, is named after Congressman Patman.

What These 22 FCU’s Help Us See More Clearly

I’m not sure what is in the cooperative DNA of these credit union managers and boards.   But it might be worth learning more about.  For if their attitude and efforts had been shared by the entire FCU system, the could be as many as 2,338 more credit unions active today.   They would not necessarily be a State Employee or a Long Island City Postal, but they would be serving  a perpetual need human need with an institution they own.

Today credit unions rarely close due to external forces or financial failure.  Rather leaders of sound institutions  at the close of their tenure merge their credit union to reward themselves with an additional cash payment.  Unfortunately, credit unions are not exempt from personal cupidity.

One of the lessons these 22 and the oldest commercial companies provide:  the needs for these services does not go away.  That alone should be enough to keep the lights on when the harbingers of combinations issue their predictions of inevitable consolidation.

And the enduring need for values based, honorable leadership of these organizations.


A COVID Program to Assist Smaller Credit Unions That Few Know About

Note:  the numbers initially published of eligible credit unions were updated as of October 7, 2021.

Recently the former NCUA General Counsel Bob Fenner, now in private practice, asked if I was aware of the Employee Retention Credit grants provided under the Cares Act.

I had no knowledge.   He sent me a brief description:

There is a provision in the federal stimulus legislation not well publicized and not well understood that may entitle a credit union to significant federal funds.   

The criteria to qualify are:

  • the credit union averaged fewer than 500 full-time employees in 2019, and
  • the gross income in quarter 4 of 2020 declined by 20% or more when compared to quarter 4 of 2019, or
  • gross income in any quarter of 2021 declined by 20% or more when compared to the same quarter of 2019.

The reason for the decline in gross income does not matter.

The credit union is eligible for up to $7,000 per employee per qualifying quarter in federal funds, in the form of so-called Employee Retention Credits. 

Finally, if your CU has an 80% or more interest in one or more CUSO’s, you must consolidate the books for purposes of determining the number of employees and applying the gross income test.

This IRS official website gives a January 26, 2021 update on the program’s extension into this year.

Estimate of Number of Credit Unions Eligible


Scanning the data for credit unions with fewer than 500 employees in 2019 and declines in total revenue in one of the three applicable quarters (2020-4th, 2021-1st and 2nd) shows the following count:

For test 1 (empl <500 @ 2019, 4Q ’20 income -20%+): 782 CUs

Test 2 (excluding test 1): 350

Test 3  (excluding test 1 & 2): 135

The total of 1,267 includes mostly smaller credit unions.  However the results show that a few credit unions with over $1 billion would also qualify.

This list could be expanded if additional credit unions meet the negative 20% fall in revenue for the third and fourth quarters of 2021 versus the comparable quarter in 2019.

Next Steps

Bob is working with a colleague, Darrell Smith, CEO of Highmark Companies.  He describes their approach as follows:

There is no fee for a consultation and a determination whether a CU qualifies. There is a fee only if a CU qualifies and uses our services to obtain the credits. We don’t talk fees until we do the initial consultation.  

Our services include determining qualifying amounts, preparing the forms to be filed with Treasury, providing a pre-submission audit review from an independent accounting firm, and working with the CU and their payroll provider to submit to IRS.

He continues:  It is a complicated process unless you have studied it carefully and understand it. Sometimes credit unions who have not carefully studied the law and the IRS guidance often conclude either they are not qualified when in fact they are, or they don’t get everything they are entitled to.

Once you understand all the ins and outs of the process, it does not take long to complete the forms. It does however take anywhere from 2 to 10 months to receive the money from the Treasury Department. So while it is definitely good money that qualifying credit unions are legally entitled to, it’s not quick money.

As one example, we recently worked with a with 55 employee credit union that will obtain $1.1 million based on the first three quarters of 2021.  We will assist credit unions of any size.

Resources to Help

Bob’s contact information is  bobf1228@gmail.com and  Darrell Smith at Highmark Companies is dsmith@highmarkcompanies.com.   The only information about their program is what they have sent me.  So as with all contacts, credit unions should always perform their own due diligence, as I am sure Bob in his former General Counsel role would advise.

I am not aware of any other organizations providing credit unions assistance to access this program’s funds.   Bob’s heads up could be a valuable service especially if smaller credit unions who are likely most in need, can be easily qualified.

If readers have other information on this program that would benefit credit unions, I would be glad to offer it in future posts.


New 2020 Census Data for Market Analysis and Planning

The US Census Bureau has just released a map with updated boundaries for the country’s 392 metropolitan statistical areas (MSA’s) and 547 micropolitan areas using the 2020 census.

These areas are the geographic marketing segments that companies and most other organizations use when tracking and analyzing consumer behavior.

America is the third most populous country in the world with over 333 million persons living in 20,000 towns and cities.  These statistical divisions separate this national market into city and regional clusters for local analysis.

This latest Census Bureau map is presented and analyzed in an article from Visual Capitalist, a firm that specializes in translating all forms of data into graphs, pictures and dynamic charts.

The article presents the ten largest MSA’s and links to the full list of 392 in descending population size.  It also shows the percent change in population in each MSA over the past decade.  An MSA is determined by having one population center of at least 50,000.

The article describes the smaller micropolitan regions as “the smallest areas measured on the map generally located further away from large cities, have at least one urban core area of at least 10,000 but fewer than 50,000 people.”  These micro segments may be more relevant for identifying credit union opportunities than the larger MSA’s.

Context for Strategy

This information can be vital for credit unions who want to understand the environment in which they are currently operating or might target for future expansion.   Some information such as the annual HMDA filings for all mortgage applications already provide data by MSA.

As both credit unions and banks report their branch locations (and local deposits) at least once per year, that information could also be assigned to these census bureau categories.  One could then determine which micro markets are less well served by existing institutions.

The challenge will be to find a firm which will incorporate these most recent population trends with branch and deposit data, HMDA reports and other federal statistics into their databases of credit union information.  Then convert this data into visual maps for use, ideally with a point and click capability information pop out per area.  Unfortunately, the Census Bureau map does not provide this mapping dynamic.  A pdf of the map can be seen here.


What Can $1,000 Buy in Credit Union Intelligence?

On September 2, 2021, I received an invoice for 40 hours of work at $25 per, for a total of $1,000.

The service included consultation, designing, programing, testing and updating an Excel spreadsheet that allows any user to project the NCUSIF’s year-end equity using the latest data and forecasts.

It was not a simple task.  There are four variables each using different math concepts:

  1. The % rate of insured share growth.
  2. Operating expenses in $ charged via the OTR.
  3. Anticipated loss in basis points of year end insured shares.
  4. Yield on NCUSIF investments expressed as an APR.

With beginning numbers from the NCUSIF 2020 audit, these four variables must be programmed in a dynamic way so that the outcomes in dollars and basis points versus a year-end NOL target (1.3%) can be instantly updated.

Later numbers can be inserted as the year goes forward.  This is the only management model needed for the NCUSIF. The fund’s basic 1% underwriting design, its unique loss reserve accounting practice, and the almost 40 years of experience have validated its long-term resilience no matter the event or economic circumstances.

Completed in 40 Hours

The student who did this work is a college senior majoring in “leadership.”  I explained the goal, and the input parameters.   We talked by Zoom, sharing our screens  using Google Docs, and working together to test the functioning.

Here is a link to the finished spreadsheet.  It uses a year-end NOL “target” of 1.3%, share growth of 10%, and the latest data on operating expense and loss experience: https://docs.google.com/spreadsheets/d/1eAZN2CjyNkgu9bfuUXIF1xmFPBwLvAio/edit#gid=2118513014

The spreadsheet can be copied for use by anyone.  The user can fill in more recent data or other assumptions believed to be more accurate.   With the current input, the year-end equity NOL outcome would be 1.2876 or just shy of the 1.3% goal.

Is This Modeling Tool Sufficient?

The spreadsheet includes all the major variables.   The NCUSIF sometimes has accounting entries that are not related to current events creating deus ex machina  financial interventions as in a theatrical performance.

One example is recovery from prior year’s AME loss estimates which turned out to be too high.  For the past 7 years these have totaled $313 million added back to NCUSIF equity.  A second is the expense for additions to the loss allowance reserve, which often have no relation to actual experience.

Even with these minor exceptions, the tool used in conjunction with NCUSIF’s historical performance, is about as close to perfect as one could hope.  Take a look, give it a spin.

The Student  Programmer

The designer of this spreadsheet is a college liberal arts senior who also works full time for NVIDIA to help market their new Omniverse platform.

At the moment, NCUA has spent close to $40 million and over five years trying to install the MERIT data management program.   I wonder how much a bunch of smart, college kids might accomplish outside the beltway contracting environment at a fraction of this sunk expense.

The invoice ended with these words: Thanks for the opportunity to serve you (the student’s name) and the programmer’s tagline:   When you can’t, she can. 

Now that’s the coop spirit.


The Overcapitalization of the Credit Union System

Twenty-five responses were filed responding to NCUA’s request for comments on the appropriate NOL cap for the NCUSIF.  One provided an insightful context for their remarks.

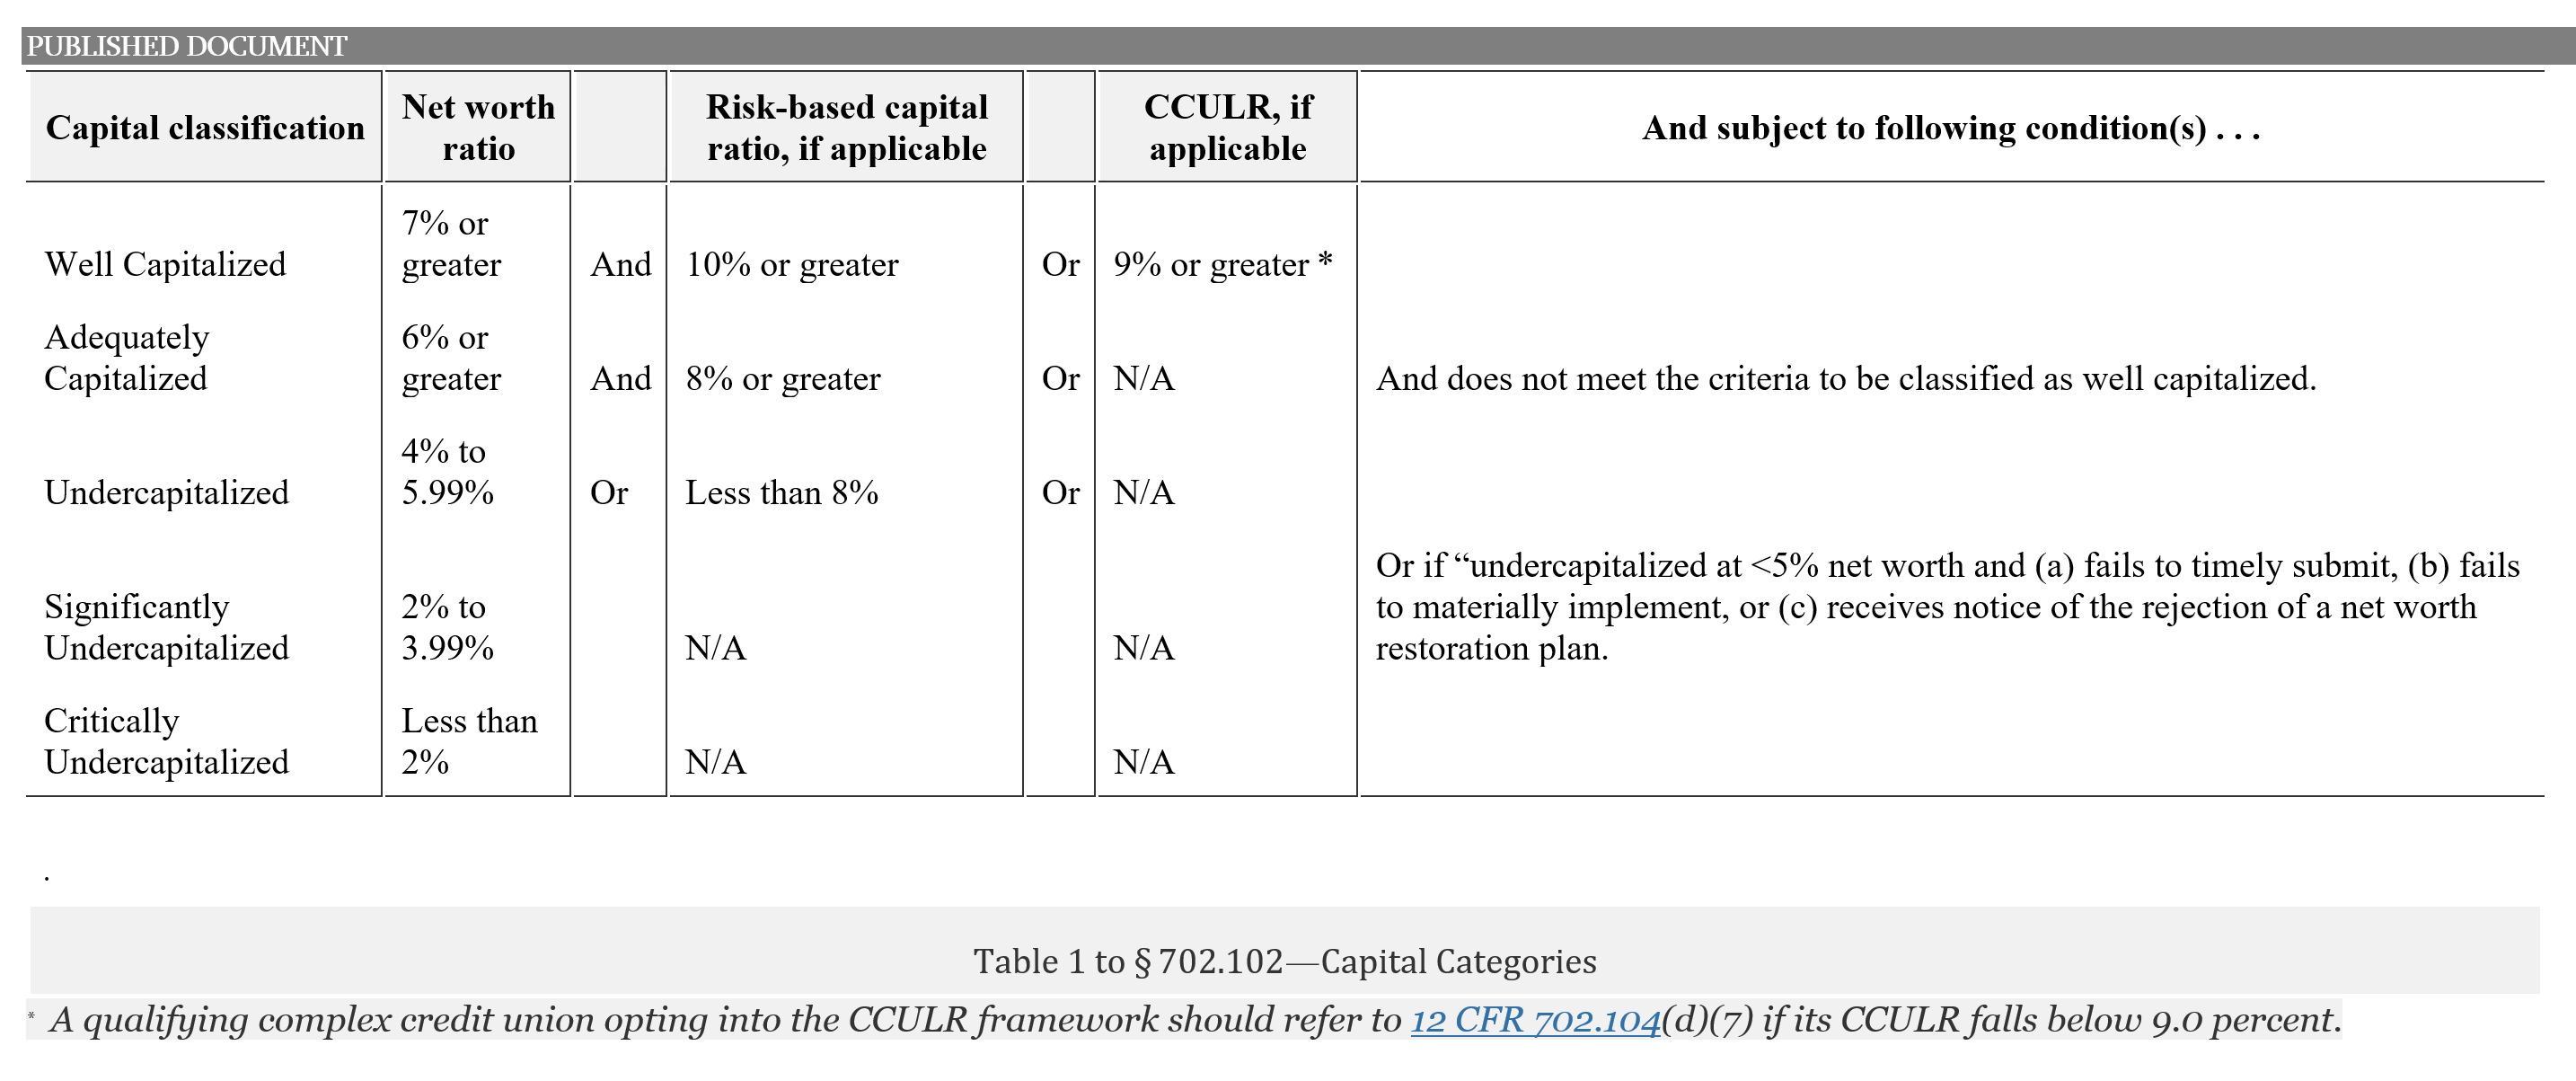
This excerpt from the Ohio Credit Union League  points out a larger industry bias.  This observation is especially relevant in view of NCUA’s proposal to raise the well capitalized standard for credit unions over $500 million in assets.  This new net worth option called CCULR, would raise the well capitalized compliance standard 43% in two years, from 7% to 10%.

Here is their partial comment:

. . .we wish to register a general objection to the notion of unnecessary over-capitalization of the credit union system wherever such an idea takes root. Except for a relatively small proportion of outliers, where ordinary supervision serves as an appropriate intervention, credit unions themselves are strongly capitalized to the extent that the primary buffer (natural-person credit union capital) against shocks to individual credit unions or the credit union system, is deep and broad.

Prior to the pandemic (December 2019) the average total capital ratios for U.S. and Ohio credit unions were 11.87% and 11.89%, respectively. As the pandemic began receding (March 2021), these metrics remain thoroughly robust (10.51% and 10.53%, respectively) despite the tremendous stresses of a global pandemic, global recession, and stimulus-driven ballooning balance sheets. The abundantly healthy capital levels and ratios in credit unions served the intended purpose quite effectively and in essence, shielded NCUSIF from material impact.

The regulatory process, perhaps beneficially, engenders a bias for more capital at the credit union level (seemingly, ever-stronger balances and ever-higher ratios). Yet this bias must be tempered by business discipline to ensure that capital balances in credit unions and in the NCUSIF remain strong but not excessive, so the various costs of capital are reasonable (even supportable).

To the extent that we witness what appears to be strong NCUA bias for more capital (unnecessarily larger balances and unnecessarily higher equity ratios) and noting the nexus of this concern to NOL strategy, we draw attention to the potential disruptive and costly over-capitalization of the credit union system at the credit union level, in NCUSIF, and particularly in combination. In this context we reiterate our call for the return of the NOL to its previous strong and proven level of 1.30%

Amen

The Corporate Resolution: Hard Truths and the Need for an Objective Lookback

The most disastrous event in the 110-year credit union story, the corporate crisis of 2008/9, has created its own myths and interpretations. The good news is that most credit unions successfully navigated the burden of paying billions of unneeded premiums.

The downside is that there has been no change in NCUA’s unilateral ability to impose its internal resolutions on problems unchecked and lacking objective data.

Edwards Deming, the founder of the quality improvement movement, stated: “Without data you are just another person with an opinion.” Opinions of the corporate events have always been plentiful and often predictable, from 2009 to today.

The latest March 2021 AME quarterly financials show NCUA’s 2010 loss forecasts and current outcomes differ by over $20 billion.

Common sense requires an independent factual commission analyze the entire event so this kind of catastrophic mistake never happens again. This is not an exercise in 20:20 hindsight. It is to prepare a full record from contemporary data, documents and participants to prevent future ruinous system outcomes.

Here’s the latest data and comparisons with NCUA’s forecasts.

AME Surpluses Grow to $3.125 BN

Total projected distributions to members of four of the five corporates now total $3.125 bn. This is an increase of $95 million from three months earlier.

Credit union shareholders in Members United and Southwest Corporate will receive 100% of their capital, plus liquidating dividends projected at $14 million and $307 million respectively, for a total of over $1.3bn. Both reported millions in regulatory capital in their August 2010 call reports before being taken over by NCUA.

WesCorp’s Deficit at $2.175 Bn

Only WesCorp shareholders will receive no distribution on their $1.114 bn of member capital. NCUA estimates the NCUSIF loss on WesCorp’s estate will be $2.2 bn. (AME: B4 Due to government)

NCUA’s Liquidation Expenses Exceed 10 Years of Operating Budgets

Section B 1 of the AME financials, “Liquidation Expenses,” reports total operating costs paid from each of the five estates of $4.786 bn. Subtracting expenses for legal recoveries (line 15) of $1.258 bn, NCUA has spent $3.528 bn administering the corporate resolution plan.

This net amount exceeds all of NCUA’s combined operating budgets from 2010 through 2020 in its oversight of 5,000-6,000 credit unions, the NCUSIF and the CLF.

Moreover, these “expenses” do not include realized losses charged to the AMEs of over $1.0 bn. NCUA incurred those additional losses by selling non-legacy, fully performing investments immediately after seizing the credit unions in 2010.

Total Surplus Approaches $6.0 Billion

NCUA boasts of the net legal recoveries of $3.8 bn. However, that amount would just pay for NCUA’s TCCUSF administrative expenses with only a $200-$300 million overage.

The growing combined surpluses of nearly $6.0 bn from the AME estates and the TCCUSF merger are from the “legacy” investment payments of interest and principal. Expected losses forecasted in 2009 years into the future, and expensed from capital, were billions in error. Instead of recognizing losses as incurred, they were written off all at once based on faulty modeling assumptions of future cash flows over the securities’ remaining lives.

TCCUSF Forecasts Billions In Error

When the TCCUSF was merged on October 1, 2017, its entire surplus of $2.562 million was transferred into the NCUSIF. However, when the liquidations commenced in 2010, NCUA projected a loss of $8.3 to $10.5 bn in the TCCUSF. This one aspect of the resolution plan’s outcome was in error by $10.6 to $13 bn.

NCUA estimated the range of total resolution costs after seizing the five corporates at $13.9-$16.1 bn. Projected recoveries were $0. The $5.6 bn extinguished credit union capital was gone forever. Additional TCCUSF assessments from credit unions ranged from $7.0-$9.2 bn.

These total AME estimates were off by over $20 billion when adding the growing surplus to this loss forecast.

These Resolution Costs Detail estimates of July 2010 were disclosed only after the seizure and liquidations were undertaken. At the same time the KPMG audit of the TCCUSF (note 6) projected a total loss of $6.4 bn at December 2009 across the entire corporate network. This audited loss provision estimate was not released until December 27, 2011, or 15 months after the liquidations commenced.

In contrast, at June 30, 2010, just prior to the five seizures, the 27 corporate call reports showed the entire system reporting gains in reserves of $260 million and significant reductions in AOCI (all other comprehensive income) of over $8.8 bn versus June’s 2009 totals.

Every corporate reported improving financial results as financial securities recovered from the depths of the market dislocations in early 2009. Instead of recognizing these positive trends, NCUA imposed a second crisis on the system by liquidating the five corporates.

The Members United Example

Corporates and the entire economy were on a visible recovery trend when NCUA initiated its September 2010 liquidations. One example: Members United had expensed $600 million in estimated OTTI credit impairments, but had incurred actual losses of only $95 million according to its final call report on August 2010. Its reported changes in the monthly valuation of its investment dislocations (AOCI) had gone from a peak decline of $2.1 billion (March 2009) to $917 million in its final 2010 call report.

Seven years later at the merger of the TCCUSF with the NCUSIF, Member United’s legacy assets had incurred only $297 million losses versus the $600 million expensed. The latest AME March 2021 financials show Members United shareholders will receive $605 million from interest and principal pay downs on their corporate’s “legacy” investments.

Independent Review Critical to Learn Hard Truths

The organization ultimately responsible for the safety and soundness of the credit union system is NCUA. The agency had the resources and authority to lead a mutual least cost outcome. Instead, acting unilaterally, in secret with no communication with those closest to the events, the agency abruptly closed the four largest corporates plus the $1.2 bn Constitution Corporate. The agency justified these actions by publishing loss projections significantly greater than KPMG’s audited numbers.

The agency that was supposed to protect and keep the system safe turned into its prime executioner. Did no one object to the plan? Were no alternatives reviewed? What factual data was the basis for the actions when all the 5310 monthly reports showed recovery was underway?

The billions in unnecessary TCCUSF premiums, the denigration of corporate personnel and their network’s critical contributions, the effective dissolution of the CLF’s liquidity safety net, are all disastrous individual events.

But the ongoing harm is even greater. Credit unions’ trust in the agency and its willingness to work mutually with credit unions is still in doubt. The agency shut itself off from public dialogue, asserting its independence and provided no timely information or objective data—all characteristics part of its current culture.

Reform will only occur when this past event can be honestly presented. Facts should be the basis for truth; and the voices that were ignored or blamed, should be asked their points of view.

Without a transformation in NCUA and credit union interactions, the cooperative option will seem at best, disjointed; at worst, a system where the NCUA’s accountability for safety and soundness is still absent.

We will never know if wiser leadership might have avoided this regulator-induced catastrophe. The purpose of an independent, expert commission is not to change the past. Rather it is to inform future regulators, wanting to act unilaterally, from sending more credit unions over the cliff.

Historical Trends & Today’s Share Growth

How unusual is credit union’s 20.3% share growth in 2020?   Or the slight uptick to 23.2% for the 12 months ending March 31, 2021?

For the decade ending in 2020, the credit union system’s compound annual share growth (CAGR) was 6.7%.

Share growth drives the balance sheet.  The two sources for shares are expanding existing member relationships and adding new members.  The rate of new member gain in this same decade was 3.4% (CAGR).  This suggests a balance of internal and external growth sources.

In 2020 however, new members grew at 3.3% or just 16% of the total gain in shares that year.

The 2020 results remind one of the marketing adage about finding more business: there is always more business to be gained from existing customers than from acquiring new ones.

In plain speaking, if existing members aren’t growing their relationship, why will new ones find your offerings attractive?

Data Source:  Callahan’s 2020 Credit Union Directory (pgs. 1-2)