As the new administration’s post election appointments and policy directions are implemented, the credit union system is on a stable foundation.
There are still latent issues of vital importance, most of which the NCUA board has adeptly avoided. But the macro-financials reported in Callahan’s 3rd Quarter Trend Watch overview yesterday are strong and heading in the right direction. This is the link to the 72 slide deck. The full recording is available here.
Some observations I noted:
Improving liquidity: In Alloya Corporate’s economic summary they presented their balance sheet trends to show the industry’s improving liquidity position as demonstrated by the growth in members’ deposit balances.
For all natural person credit unions, total borrowings have fallen and are now only 5.2% of assets, loan and share growth are in even balance, and the market value in underwater investments has recovered another $9 billion in value. Liquidity is coming back.
Slow Growth
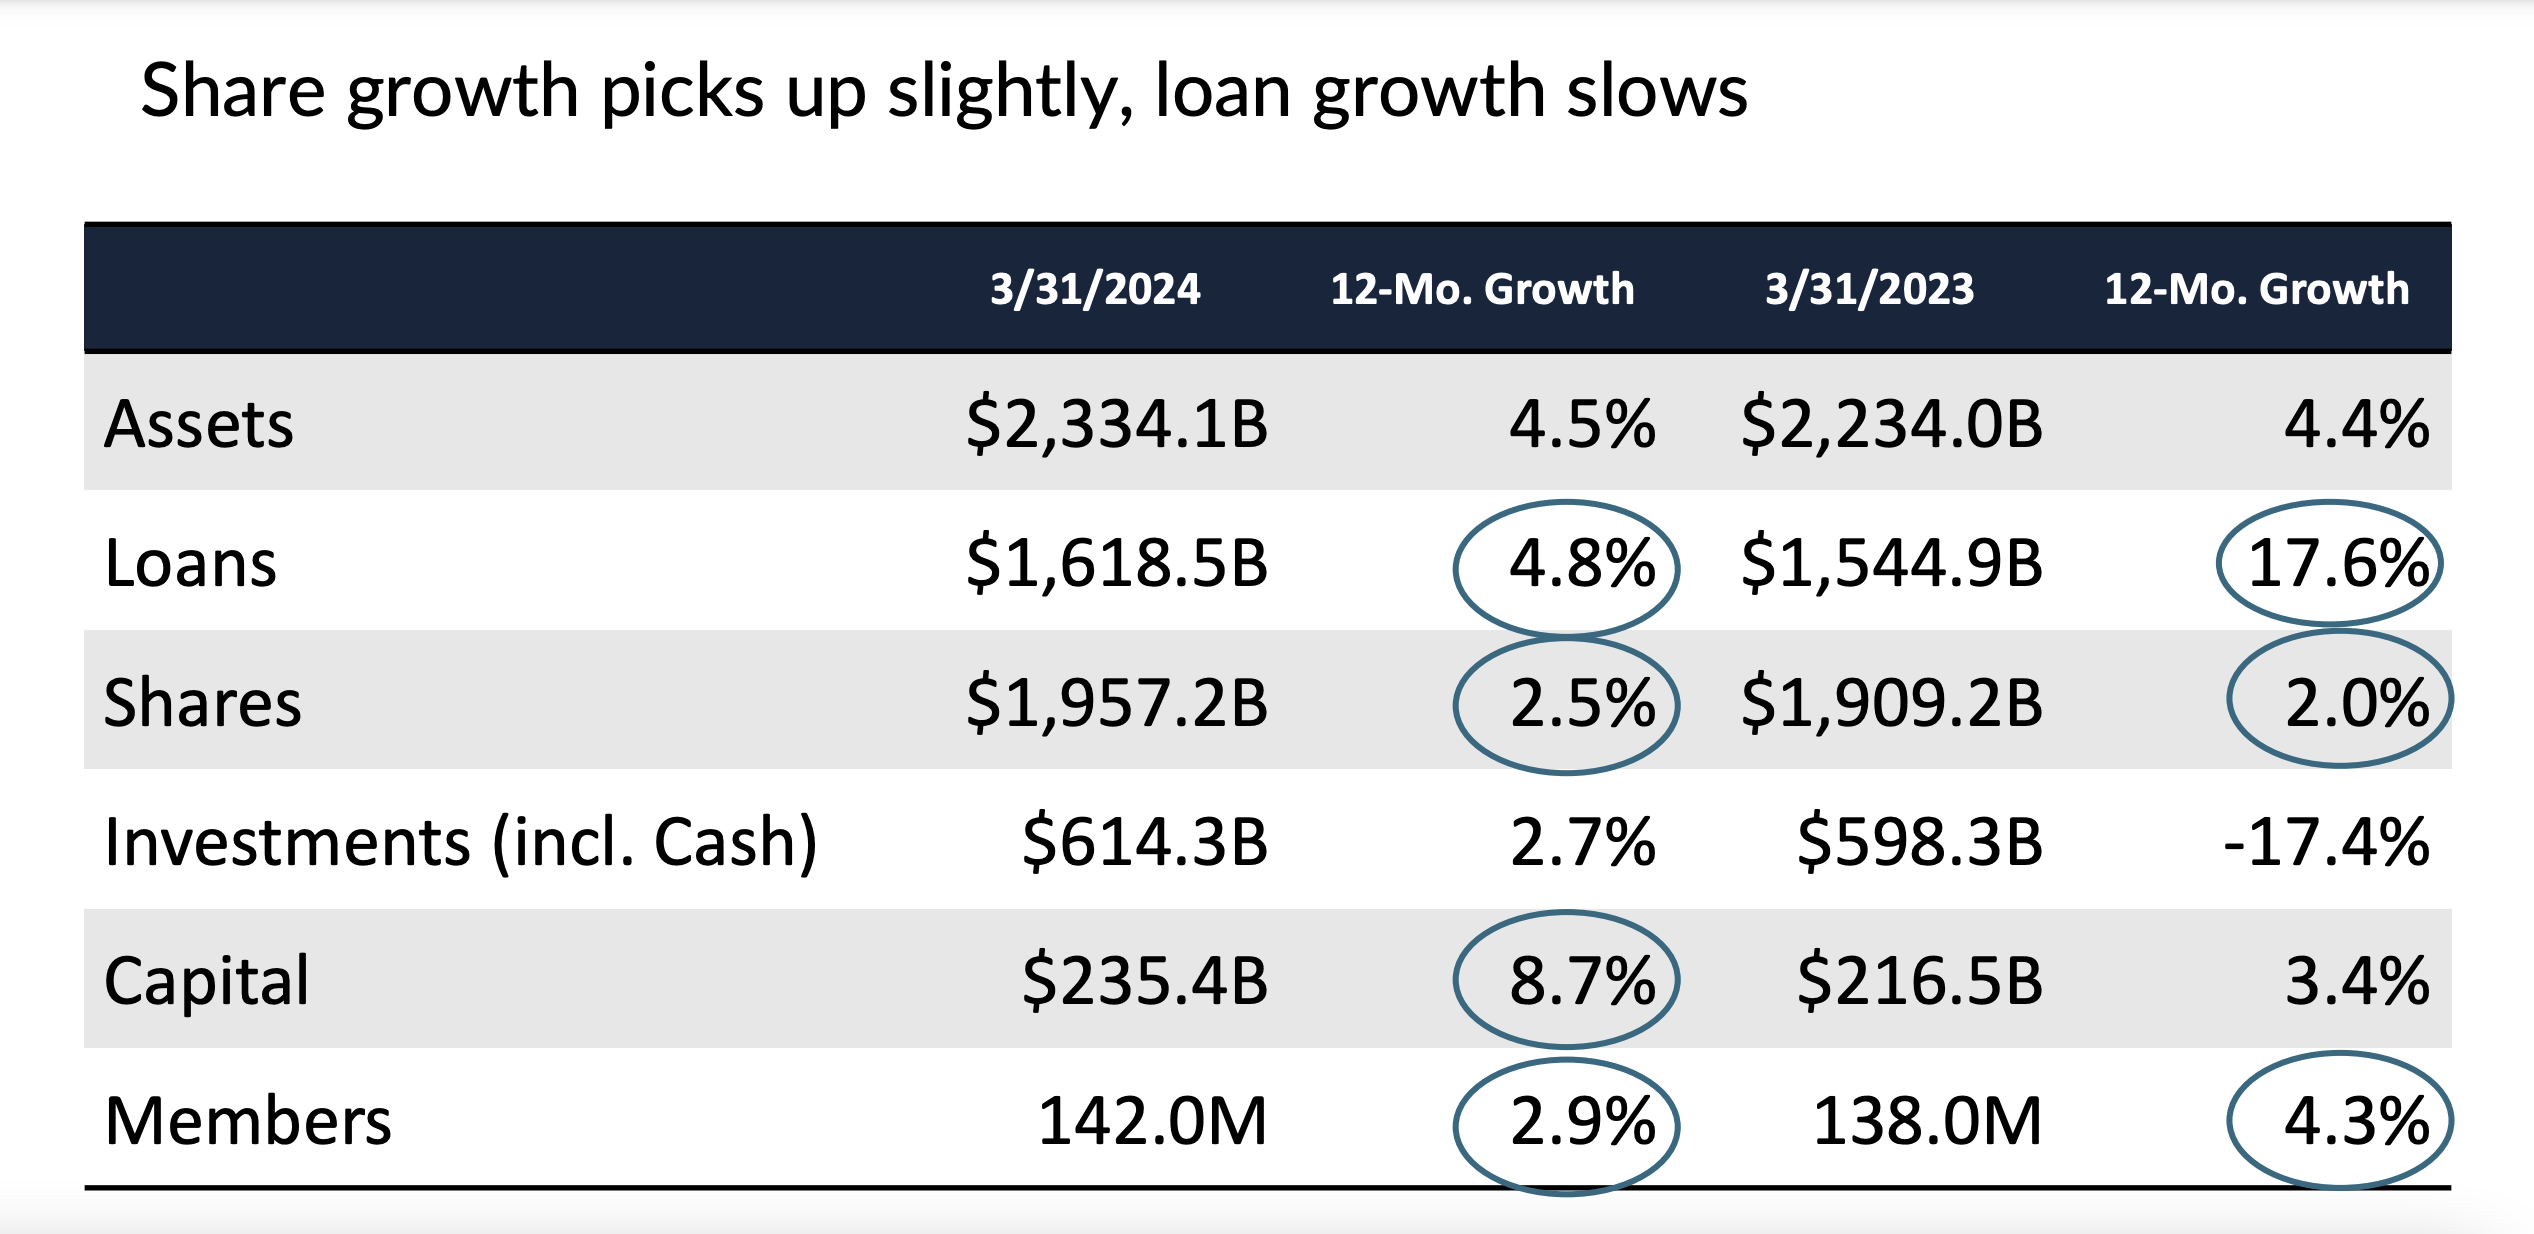
The overall theme for this quarterly update was balance sheet growth much less than the industry’s CAGR over the past 20 years. The September 2024, 12-month share increase was 3.2% versus 6.3% over the past two decades. For loans, the latest 2.59% growth is less than half the 20 year average of 7%.
An interesting statistic about the 2.5% in additional members is analysis showing credit unions with organic growth grew faster than those institutions relying on third party loan originations, a common means of adding members.
The upside of this modest growth was that the various measures of total capital and net worth(10.8%) have all increased versus one year earlier.
Takeaways In a Changing Administration
The credit union system was financially strong before the election. Nothing has altered this fact. A change in regulatory leadership is coming. Questions credit unions might consider as this political turnover occurs might be:
How will this change affect your members’ lives? Will the direct governmental assistance of the COVD era and programs such as student loan forgiveness end?
How will reliance on market outcomes affect lending opportunities such as climate related projects or electronic vehicle sales?
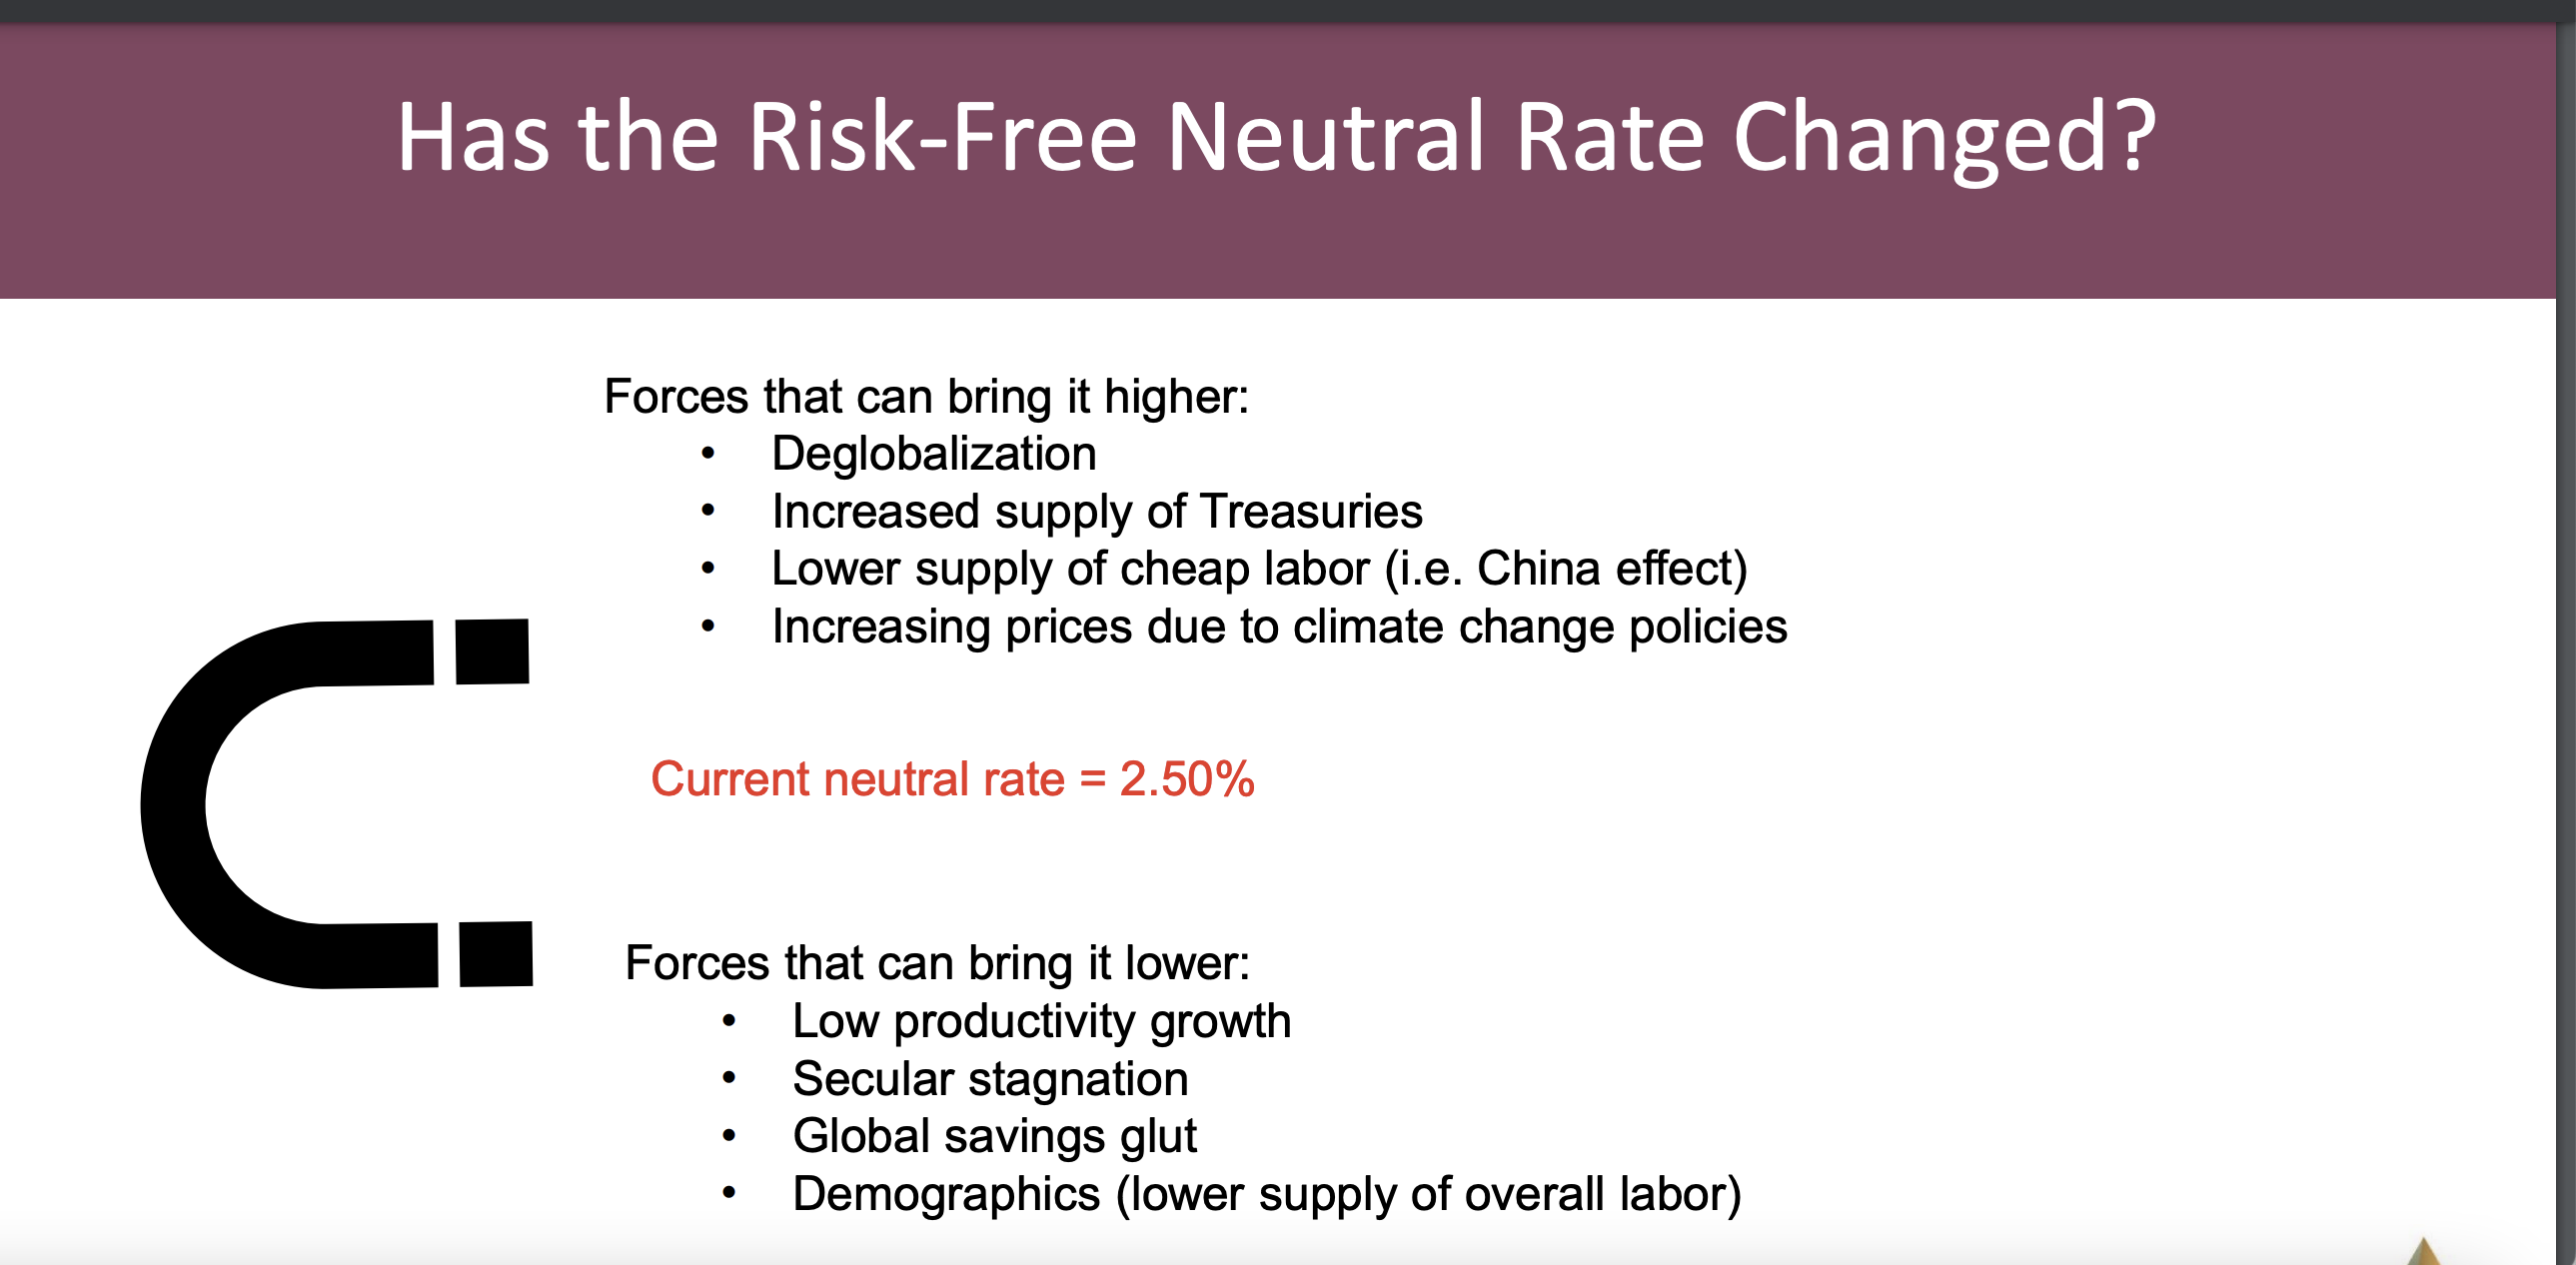
Will the new normal in the Fed’s overnight rate settle in an expected range of 2.5-3.0%–or will fiscal policy drive a higher or lower level?
With a more market-oriented administration, will the unique role of credit unions be sustained, or will the industry just be seen as another option in an ever expanding lineup of fintech, bitcoin and other financial providers.
In a future blog I will explore issues of regulatory policy and present a case study of a prior time of major change in administration.
The Good News
The good news for credit unions at this moment of national policy changeover is that they are in a sound position to deliver for members on all of their traditional service options.
They can continue to help members who feel vulnerable or overlooked. And maybe they can bring to those struggling with inflation or even bigger goals such as buying a home, even more responsive financial solutions in the four years ahead.
Synopsis:This detailed analysis of Credit Union 1 (Illinois) presents a pattern of declining financial performance covered up by multiple merger acquisitions, one-time sale events and rented capital. The future fortunes of eleven local sound credit unions have been destroyed in just two years. I believe this kind of predatory activity, left unexamined by all those in positions of responsibility, will lead to a reassessment of the advantages of the credit union charter by external legislators.
The article’s length is to present as much of the facts from these events so readers can make their own assessments. The situation summarized is I believe an example of internal industry reckless actions which present a false perception of success. The question for readers is: Does something need to change?
When there are no guardrails for a financial institution, anything goes. It is the law of the jungle; or what some describe as free market capitalism.
The dictionary definition of rogue is “an elephant or other large wild animal driven away or living apart from the herd and having savage or destructivetendencies.” Another reference is to unprincipled behavior by a person or persons.
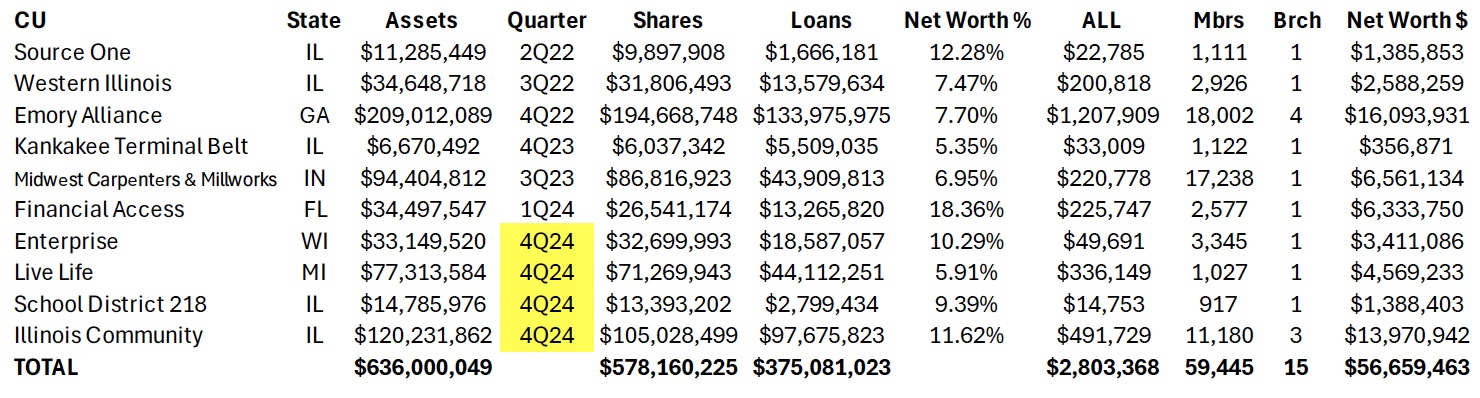
This word rogue came to mind as I reviewed the activities and results of Credit Union 1 in Lombard, Illinois, since its conversion from ASI share insurance to NCUSIF in February 2022. A summary of the credit union’s merger tempo since this insurer changeover is shown in the following table for the ten already completed or scheduled to be by the 4th quarter of 2024.
In addition, the $12 million Synergy Partners CU, Chicago announced on October 17 a members’ vote for January 2025 to merge with Credit Union 1. That would increase to 11 mergers in only two- and one-half years. These will transfer over $650 million in total assets and over 62,000 members’ financial futures to Credit Union 1’s control.
In its October 2024 Member Notice, Synergy listed 23 Credit Union 1 branch operations in six states including the head office in Lombard, Illinois. The two furthest branches are in Bradenton, FL (1,230 miles) and Henderson, NV (1,750 miles apart).
Other new or ongoing initiatives along with this accelerating merger expansion activity include:
The credit union’s continuing and new sponsorship and marketing promotions with four outside organizations:
The Western Conference tie-in: On October 3, 2024 the Big West Athletic conference announced Credit Union 1 had become its official financial and literacy partner and the entitlement partner for the Mountain West Basketball Championships and all Olympic Sports Championships.
On June 3, 2022 Credit Union 1 announced agreement to purchase the $311 million NorthSide Community Bank, located an hour north from Lombard in Gurnee, IL. Both boards approved the transaction subject to regulatory and bank shareholder approval. The deal was not completed. There was no public explanation.
In May 2023 Credit Union 1 announced it would serve New York cannabis entrepreneurs who plan to open marijuana businesses as part of the state’s CUARD coalition. The same CUTimes article reports, “Credit Union 1 has been selected to participate in the Illinois Department of Commerce’s Cannabis Social Equity Loan Program and is also the preferred banking partner of the Chamber of Cannabis in Las Vegas..”
Even with these multiple marketing and business initiatives, the core of Credit Union 1’s growth efforts are mergers. The operational intensity of acquiring and converting 11 credit unions (six outside Illinois) and all associated member and vendor relationships in just over two years would be a major operational challenge for any organization.
The immediate question is how will the members of the merged credit unions benefit?
In the Member Notices posted on NCUA’s website for these combinations, the wording used under Reasons for Merger, Net Worth and Share Adjustment or distribution are identical. Members’ collective reserves are never distributed to owners even when the merged ratio is higher than Credit Union 1’s.
But zero is not what several of the merging CEO’s and senior staff are gaining.
Rewards for the Enabling CEOs
In the case of the $34.4 million Enterprise CU in Brookfield, WI, the 24-year tenured CEO, Jeff Bashaw, will receive a minimum ten-year contract with a base salary increase of $38,000 on top of his current compensation. I estimated (absent the required 990 IRS filing) that to be a minimum of $125,000 per year plus a $100,000 bonus upon closing. Total minimum amount $$1,350,000.
The credit union is in sound shape at 10.6% net worth, a profitable, single branch with low delinquency. After turning over his CEO responsibility, Bashaw’s role if any will be a branch manager or other honorary title. This ten-year contract with a pay raise seems merely a lengthy sinecure. The 8 employees and 2,815 members receive nothing-except the retiring CFO who will receive a bonus and severance of $110,000.
A Minority Depository Institution Leader?
At the $34 million Financial Access FCU in Bradenton, FL, the situation is more complicated. The credit union prior to merging, reported a 1Q ’24 loss of $517, 310. However, its net worth was still high at 18.4% ($6.4 million) and delinquency of only .39%. Was this a temporary loss or other problem?
In this merger CEO Sherod Halliburton is receiving a total of $3.2 million composed of a bonus of $125,000, an eight-year employment contract at $200,000 per year, and 100% immediate vesting of a $1.5 million split life benefit plan. He no longer has any CEO responsibility as the credit union will become merely a branch operation. The 15 employees and 2,577 members of Financial Access received nothing for their loyalty.
In a CEO Profile published by Inclusiv in February 2022, prior the merger efforts, Halliburton is lauded for his leadership. The article remarks on “his strong community ties and business acumen and how he decided to “bet on me” when offered the CEO position” eight years earlier. Further he points out that he is “one of a limited number of African American men running a financial institution and he accepts the great responsibility accompanying that honor.”
The profile lists his efforts “toward racial equity and responsibility.” He states, “We’ve gone from a somewhat negative perception . . . to now being viewed as a vital part of the economic infrastructure.” The credit union received two technical assistance grants to upgrade technology to meet his goal to double membership in three years. He closes with this affirmation: “We’re here to change lives. I want that to be the enduring message even when I’m gone.”
This Bradenton community credit union which he described as “a vital part of the economic infrastructure” no longer exists. Halliburton is now a Market VP for Credit Union 1 for the next eight years.
An October 2024 Approved Merger
The most recent example of CEOs cashing in is the $116 million Illinois Community CU with over 11% net worth and delinquency of .5%. In this acquisition, CEO Thor Dolan will receive a minimum in immediate total benefits of $1,904,494.
This total is described in the Member Notice as follows: a retention bonus of $150,000; deferred compensation of $50,000; a salary increase of $33,724 added to his 2023 reported 990 compensation of $245,770 or $279,494 per year (no employment length given}; and immediate 100% vesting of a $1,425,000 split dollar 20-year life insurance benefit plan.
This salary increase is despite the fact he is no longer CEO, either managing branches or a regional rep, both with no CEO operating responsibilities. Every additional year he remains employed will add another $280,000 to the package. There is no indication the 38 employees (except the CEO and CFO) gain any assurances of employment; and the 10,482 members receive nothing.
The Fates of the Merged Employees and Members
Each Member merger Notice posted by NCUA which I reviewed includes two standard assertions:
The credit union’s branch location(s) will remain open and become a part of Credit Union 1’s nationwide branch locations.
Employee Representation: Employees of the credit union will be offered employment with Credit Union 1.
However intended, neither of these statements have proved lasting in practice. Comparing the branch listing in the August 2023 Kankakee Valley Notice with the latest listing in the Synergy’s October 2024 Notice, six of the branches in the earlier Notice no longer exist, including three for Emory CU in Georgia and three for Illinois credit unions with single branch operations.
As for employees’ fate, for the twelve months ending June 2024, Credit Union 1 reported a reduction of 67 FTE from 418 to 351.
As a result of Credit Union 1’s merger strategy, there will be eleven fewer local charters which were operating well, a reduction of 70-80 volunteer directors and member committees, and loss of all local relationships and legacy brands.
All member savings and loans, collective capital, liquidity and fixed assets are now in the full control of an institution for which the members have no connection or first-hand knowledge. And in some cases thousands of miles distant. Ironically, Credit Union 1 states in all its promotions that anyone can join, so if members really thought this was a better deal, they could join anytime. But that would be a much harder marketing task than just purchasing the business by paying the CEO—and getting the members’ accounts and accumulated reserves for free.
Members also have a totally new financial institution relationship to navigate. The Credit Uniion 1 material sent to each member post-voting is a 15 page pdf system conversion process and timeline. Member instructions include setting up new payment and loan options, establishing digital accounts and using online financial tools.
Depending on the version usent, the membership agreement for each merged credit union is a minimum and 20 pages. It contains essential information about fees, rates, funds availability, mandatory arbitration and multiple other disclosures which few will be able to read through. The members will learn through experience how everything has changed.
An important difference in Illinois state versus federal charters is the use of proxy voting in all member required elections, including mergers. For Illinois credit unions, proxies are controlled by the board. I did not see this fact disclosed in the FCU mergers, where proxies are not permitted. In essence, FCU members turn their voting governance power over to a new board. These directorst can routinely reappoint themselves without any member vote. More about this later.
Implementing a Capital Markets Strategy-Without the Risk
Credit Union 1’s merger campaign is an adaptation of a traditional capital market strategy of hedge funds and investment firms. Except these buyouts of numerous, smaller independent firms in an industry (think hospitals, barber shops, rental housing, or local HVAC firms) require putting their own capital at risk. These new hedge fund owners then burden their acquired firms with the debt used to finance the buyouts, strip and sell the highest value assets, reduce costs and services to pay for the debt coverage, and ultimately resell the merged business back to the market for a capital gain.
Credit unions reverse this model in mergers—they use the acquired assets, not their own members’ capital, to finance these acquisition sprees. Except when buying banks. The equity in these “mergers” is often transferred in full with no payout to the owner-members. The only necessary sales pitch required is to convince the CEO to bring the board along. There is zero risk to the continuing credit union. The “acquisition” is free. The members lose all their financial and institutional legacy and become subject to the control of a board and CEO that will be completely new to them.
We learn in the Notices that no staff or board due diligence or alternatives is presented. There is rhetoric about “technology and systems that align with members needs.” And, how “internal core values align with our own and . . . confident (that) members will experience a much needed upgrade in the quality of service.” No facts, just vague promises.
These same words were used in the eleven Notices showing the abdication of any director or CEO independent assessment. The words are merely a formula from previous transactions to pass regulatory approval. The members are given no objective measures or specifics that would identify better rates, fees or specific services. Just indefinite promises.
As for core values, institutions don’t have values, people do. So the acquirer’s goal is to find CEOs willing to cash out of their leadership role, rather than evaluate what is in the members’ best interest.
The Numbers Show the Urgency in Credit Union 1’s Merger Efforts
Some readers may believe this is just another example of self-dealing in mergers. It is. But there is a major financial imperative driving this effort.
Credit Union 1 is desperate for mergers not simply for growth, but because its financial performance is a house of cards. For the past five years it has been unable to generate a normal operating net income from its own balance sheet assets. As a result, it has turned to non-operating gains, acquired and borrowed capital (sub debt) and other financial options that disguise its very poor or sometimes non-existent internal rate of return. Here are some of the numbers.
At December 2021, Credit Union 1 had $106.8million net worth ($98.9 Undivided Earnings -UDE- and $8 m other reserves). The net worth ratio was 8.7%. Net income of $13.8 million that year was largely driven by a $7.5 million non-operating gain on sale of fixed assets.
At June 2024, the credit union reports just $88.6 million in undivided earnings, $8 million in other reserves for a total $96.6 million, that is $10 million lower than at December 2021 total.
To report an acceptable net worth ratio the credit union now includes $20.5 million in subordinated debt (borrowed capital), $45.1 million in equity acquired from credit union mergers, and a $7.1 CECL transition reserve. Without these non-operating additions to reserves, Credit Union 1’s net worth ratio would be only 5.8% versus the reported 10.2%.
But even the $88.6 million in UDE at June 2024 is misleading. At yearend 2020 the credit union reported $16.9 million in land and buildings. Three and a half years later, June 2024, the total is just $2.9 million. In the same period the credit union reported $15.1 million gains on sale of fixed assets. In the 18 months ending June 2024, the credit union also had non-operating gains on loan sales of $4.6 million.
It is not possible to determine how much of these sales are from Credit Union 1’s own assets or from the loans and fixed assets acquired via mergers. These sales amount to almost $20 million of the $88.6 reported UDE in June 2024. These are one-time events that are reported in net income thereby adding to retained earnings, but in fact are non-operating, one-off gains.
Safety and Soundness Questions
If these one-time gains are subtracted to show actual operating net worth generated from continuing operations, the net worth ratio from internal operations would be only 4.6%. Hence the credit union’s drive to raise external capital (sub debt) and acquire other credit unions’ reserves. Its dependence on external capital and one-time sales raises significant safety and soundness questions.
Internal operations are not generating sufficient capital to maintain required net worth minimums. For example, in the full year 2023, the credit union would have reported an operating loss of $429,000 except for the one-time gains on sale of fixed assets and loans. Through the first six months of 2024, the credit union’s ROA is only .39% or just .23% without extraordinary gains. (all data from NCUA tables)
The financial results are in even steeper decline than what is presented. If one considers the impact of adding merged shares and loans from the preceding four quarters prior to June 2024, there are critical balance sheet trends. These five mergers added approximately $210 million in loans and $346 million in shares to Credit Union 1’s balance sheet. Without these external gains, the credit union’s decline in outstanding loans for the 12 months ending June 2024 would have been $288 million or 24%. For shares, the falloff would be $73.3 million or a negative 5.5%, not the 4.6% increase reported. The credit union also relies on $35 million in external borrowings for funding.
Since converting to NCUSIF, the credit union has reported growth and acceptable ratios only through the acquisition and then sale of fixed assets and loans, and using the free transferred capital to maintain its required net worth.
What to Do About a Runaway Credit Union?
Once NCUSIF-insured in 2022, Credit Union 1 has been on a merger and marketing binge which is hiding serious financial performance shortcomings.
In all credit unions the Board, as a group, holds the direct, legal fiduciary responsibility for the performance of the credit union. The Board members approve all policies and hire the leadership. The buck stops with the Board members – all of them.
This is especially true in Illinois which has an unusual provision in the state act that allows the board to collect proxies from all its members, thus giving the board full decision-making authority in all areas, including mergers.
This is the reason for the extended proxy explanation in the Notices of Merger of the five Illinois chartered credit unions which reads in part:
Illinois permits voting on merger proposals only at the meeting or by proxy. If you do have a proxy. . . you may do nothing, and the board will vote in favor of the merger in your sted. . . If you have a proxy on file, to vote NO you must revoke that proxy by giving written notice to the board secretary. . . and then assign a new proxy to an attending member.
This is why all mergers of Illinois’ state-charters are reported as virtually unanimous. The process also puts a higher standard for due diligence and fiduciary responsibility on board members as they are now acting directly for the member.
There have been several recent class actions against credit unions around improperly disclosed overdraft fees and cyber breaches. When merged Credit Union 1 members confront the reality of losing their independent cooperative some may be deeply upset. With their board’s unilateral actions and failures to document their duties of care and loyalty, these transactions could become fertile ground for such actions.
Where Are the Regulators?
Except for the several federal charters merged, initial approval is by the state as Credit Union 1 is Illinois chartered. Most of the credit unions merged in MI, WI, GA, IN and IL are state chartered. All the data cited above is in public call reports and in multiple year analysis formats on NCUA’s website.
The trends for Credit Union 1 are clear, the extraordinary payments to CEOs presented in the Notices, the copy-book wording in the Notices all the same, and the vigorous public marketing communications easily reviewed for this nationally aspiring credit union.
NCUA routinely signs off on all mergers even those characterized by extraordinary self-dealing (eg. CEO contracts with change of control clauses), no clear business logic or member benefit, and Notices with misinformation, disinformation and missing critical facts for any member to make an informed vote on the issue.
There are indications that this hands-off response is the NCUA staff and board’s preferred laissez faire policy. The outcome is fewer credit unions by encouraging smaller credit unions to merge with larger ones driven by monetary payouts to achieve their policy of industry consolidation. But of course there are no asset limits as recent merger announcements have demonstrated.
The explanations for this dual chartering supervisory failure are wanting. In some instances, it may be a repeated failure by staff to do any elemental analysis. To my knowledge, there has never been a regulator “look back” to see if any of the merger commitments were followed up—even in a situation involving $12 million in members’ capital diverted to the merging CEO and Chair’s newly organized non-profit.
Regulators appear to lack a common sense understanding of events, not wanting to see or address the obvious conflicts of interest and board fiduciary failures. They thereby become part of the problem, abetting the worst aspects of cooperative leadership.
The result is no regulatory guidance or even backbone to stand up for members‘ interests or rights. There is no director-board check and balance on CEO’s ambitions or performance. And no regulatory effort to hold accountable those credit union CEOs who use their positions of power and institutional wealth to take advantage of the member-owners of acquired credit unions.
A System Circling the Political Drain?
Instead of expanding member economic opportunity, credit unions are imitating the tried and profitable capital market efforts to roll up their smaller locally focused brethren though payoffs and the rhetorical promises of better service through—even if only virtual.
Credit Union 1’s “purchased members” have lost the heritage and identity their cooperative predecessors passed on to them. Trust and loyalty earned over generations is gone. Members will vote with their feet when they learn there is no more advantage to being with Credit Union 1 versus dozens of other online financial offerings just as easily accessed.
Credit Union 1 has maintained its regulatory financial requirements only by acquiring other credit unions’ capital reserves, one-time sales of fixed assets and loans, closing local branches and letting employees go, and borrowing sub debt capital. These are efforts to buttress its balance sheet and cover its inability to earn an acceptable return on its own assets for its member-owners.
This practice will eventually be found out, the mergers will end. and the credit union’s safety and soundness will be much more closely scrutinized.
However, in the meantime, eleven local credit union charters are destroyed, their professional and community leadership roles ended, members’ long-time relationships to their credit union dissolved and the industry’s reputation put at political risk.
As Credit Union 1’s financial short comings become increasingly apparent, their external relations with Notre Dame athletics, the U of I Chicago campus, the new WCC partnership and Tinley Park Amphitheater will be in jeopardy. So too the industry’s public image.
I believe Credit Union 1’s actions are a threat to the future of the cooperative model. Every system has “bad actors.” That is why there are regulators. When directors fail in their fiduciary roles, and supervisors abdicate their appointed oversight responsibilities, the system’s integrity is at stake.
When other credit unions remain silent, state regulators default in their oversight, and NCUA appears unconcerned about the consequences of these events, it is only a matter of time until cooperatives forfeit their unique role in the American economy.
And should that day of reckoning come, thousands of credit unions trying to do the right thing will be end up in the same reduced status as their rogue colleagues.
Today credit unions operate in two financial worlds. One is the so called “free market.” This is where open competition, winner-take-all, buying and selling happens. Members/consumers make their buying decisions comparing options. The winners are firms with superior value propositions including better products, service, convenience and sometimes marketing.
This is the market credit unions enter when buying banks or investing in other firms (CUSO’s, Fintechs) to advance their credit union’s competitive position. Corporate transactions are marked by due diligence assisted by external experts, and financial projections with ROI’s and cash flow forecasts. Often these deals are subject to close regulatory scrutiny in addition to buyer and seller’s close analysis.
Transactions in credit union’s “off market” financial activity are not based on transparency, superior performance or even shareholder/owners best interest. This is the “insiders game” of private deal making, self-enrichment and public misinformation and rhetoric to benefit the players’ personal agendas.
Today this is the world of credit union mergers. It is increasingly a cesspool of pretend member advantages disguising payoffs to facilitate changes in control of sound long-serving institutions.
There is no owner payment or recognition as occurs in the “free market” transactions. In fact these are totally “free” transfers in which the continuing credit union is paid to take over the business. The owner’s net worth is transferred intact to the acquirer. This is the complete opposite of an open market transaction. It would never happen in a fully transparent actual market sale.
The Critical Issue
The critical question for the credit union system’s future is why aren’t members paid for their ownership interest when there is a change of control. It happens some with market facing events, but never in mergers. Without any payments upon a charter’s dissolution, member-ownership is a fiction.
Credit unions do know how to value a financial institution, their own coops and other for profit firms.
Credit union capacity and interest in buying other financial institutions, particularly banks is ever-increasing. These all-cash purchase and assumptions totaled 16 in 2022, 11 in 2023 and at least 17 announced so far in 2024.
In most purchases, the transaction price ranges from 1.5 to 2.0 times book value. Where the bank is publicly traded, the offers always exceed the last market quotation prior to the sale announcement. Here is an example.
The Most Recent Bank Purchase Announcement
Yesterday the $9.2 billion ESL FCU announced the acquisition of the $401 million Generations bank (Nasdaq: GBNY). Prior to the announcement GBNY’s one day high for the past year was $10.76. Today, post announcement, it closed at $15.75 per share.
In the announcement the bank estimates the range of final cash payments for each share to be $18-$20. From the joint press release: “ESL Federal Credit Union will pay Generations $26.2 million in cash and Generations Bank will retain its equity at the effective time of the P&A Transaction.”
Generations Bancorp has 2,241,801 outstanding shares of common stock. If $20 is the final disribution per share, then the bank owners will receive a total of $44.8 million, that is their equity and ESL’s $26.2 million payment.
We know there must be some pretty sharp financial analysts at ESL which is paying $26.2 million cash for an institution whose track record includes the following:
The bank has lost money, every quarter, for the last three quarters.
The bank has an efficiency ratio over 100%, every quarter, for the last three quarters.
This means the bank lost money, before factoring in provision for loan loss expense.
Since 2015, the bank has produced an ROA over 0.50% just once.
It’s pretax ROA through 6/30 of this year is negative 0.90%.
How Bank Purchases Should Inform Credit Union Owners
The example of credit unions paying cash in a bank P&A, effectively a liquidation, demonstrates credit union’s willingness to analyze market value and to pay up for performing financial assets. In these deals, there is no charter acquired. just an operating business.
Moreover each of these transactions is reviewed and approved by at least three very interested parties:
The owners who will ask is this price fair and a better option than not selling?
The FDIC will examine for any residual risk to the bank fund.
The NCUA will review for any safety and soundness implications and compliance with credit union regulations for acquired assets and FOM limits.
The point of this example, and almost 50 recent bank acquisitions is that credit union’s know how to value the potential future ROI of a financial institution’s assets.
So how might this skill apply to valuation of a credit union? While there are not many recent examples, there is one thoroughly documented transaction.
The Nationwide FCU Sale to Nationwide Bank
In 2006 the sponsor of Nationwide FCU announced its intent to buy its credit union to accelerate its banking operations. Founded in 1951, the single sponsor credit union was almost an extension of the insurance company. Almost all of its members were Nationwide employees, former employees or retirees and their families. The CU’s employees were all Nationwide Insurance employees and the CU performed very few of its administrative functions on its own.
The first question for the members was: “Will the 45,000 owners of the $564 million Nationwide FCU be offered enough money for their credit union?”
The credit union’s key numbers at December 2006, right after the vote were: Assets $564.1 million; Loans $ 418.3 million; Net Worth $61.5 million (12.7%); shares $489.3 million; and Members, 45,002. Nationwide was the 4th largest of Ohio’s 495 credit unions.
Further comments from an August 8, 2006 Credit Union Times article about the sale:
“When what is happening in so many other merger and charter conversions amounts to little more than thievery, the fact that Nationwide was willing to try to do the right thing means a lot,” said Jim Blaine, CEO of the $13 billion State Employees’ Credit Union.
Blaine said that his comments and support for the purchase reflected the degree of transparency that the CU has offered. “If that transparency were to diminish, if the CU were to hold back on letting its members and the public at large know about how it and Nationwide Bank arrived at the $79 million price tag, then the deal might face more of an uphill climb,” Blaine explained.
McCune and other banking analysts note that a premium of even 150% or 200% of equity for an independent CU might not be out of line and would still be considered inexpensive compared to the prices commanded by independent thrifts. . .
“The phenomenon (of a credit union sale) is more likely to remain an occasional development where banks might approach CUs which have access to particular markets or market niches and where CU members would be willing to sell. Everyone has a price,” the analyst noted,
CEO Paula Edwards said that almost 17,000 of the CU members took part in the election and that almost 90% of the members who voted cast ballots in favor of the merger.
Approving the deal means that Nationwide’s members will receive $79 million total, or roughly 15% of their account balances as of the end of March of this year as the price for the sale. The new bank will benefit from the purchase by having a readymade customer and deposit base that would have taken it months or years to develop otherwise.
The Significance of Nationwide FCU’s Sale
Members were returned all of their cooperative capital plus an estimated premium of $17 million more. This represented a gain of approximately 15% on their individual share balances. In banking sales, this valuation is often referred to as the deposit premium when valuing a transaction.
According to CU Times, there were some who thought this transaction could be an example for additional deals.
Some view the Nationwide deal as the model for the potential takeovers of credit unions. Nationwide was a very unique case, , , CEO Paula Edwards is one of the true good credit union people and had little choice in that deal. The reasons behind it can be thrown out, but what can’t be thrown out is the premium on capital Nationwide Bank was willing to pay, that’s the potential model going forward.
“This proposed merger ensures credit union members receive a financial benefit in the transaction. Nationwide has agreed to give members a payment for their ownership interest in the credit union,” said NFCU CEO Paula Edwards.
The insurer said Monday that it has decided to move away from operating as a full-service, federally chartered retail bank — the kind of place where people cash checks, sign up for CDs and the like. Instead, it plans to focus its bank-related services on those that support its retirement-plan business.
Nationwide has taken a big step as part of its plan to get out of the retail banking business.
The insurer said Friday that it is selling $3 billion in deposits at Nationwide Bank to BofI Holding, the parent of BofI Federal Bank, in a deal that is expected to close before the end of the year. The sales price was not disclosed.
BofI Federal Bank, based in San Diego, is a nationwide bank that provides financing for single-family and multifamily residential properties and small and medium-sized business in certain target areas.
Even selling to a new charter or transferring control does not assure financial longevity.
How NFCU and Bank Transactions Are Relevant Now
There are two immediate conversions from a credit union charter that will entail a valuation with potential member payout.
June 23, 20 24 the FDIC announced the following:
The FDIC approved a deposit insurance application submitted by Thrivent Financial for Lutherans in relation to a proposed Utah industrial bank, Thrivent Bank. The FDIC also approved a related merger application that will permit Thrivent FCU to merge the operations of its existing credit union into the newly formed Thrivent Bank.
The newly approved Thrivent Bank will not operate physical branch office locations and intends to deliver all bank products and services exclusively online, offering a diversified loan portfolio centered in consumer loans and funded primarily by core deposits, following a traditional bank business model. Thrivent Bank will offer products and services without regard to religious affiliation.
Thrivent FCU has total assets of $930 million and a net worth of $129 million . What will member-owners receive in this sale to an industrial bank charter formed by the Sponsoring company? Will it follow the Nationwide payment precedent?
The second event is the combination Arrah Credit Union with the $378 million, mortgage centric, Pittsfield Cooperative Bank. The details are in this August 14, 2024 Credit Union Times report:
Chartered in 1929, Arrha’s 27 employees operate three locations, and manage $110 million in loans, $122 million in total shares and deposits, and $12.4 million in equity, according to NCUA financial performance reports. The credit union posted a loss of $9,222 at the end of the second quarter.
The process to combine is very cumbersome. A minimum of 20% of the eligible members are required to vote for the transaction to proceed.
Arrha’s NIMRA application, under review by the NCUA, included 15 different documents and statements such as the merger plan, the proposed merger agreement, a copy of the bank’s last two examination reports, copies of all contracts reflecting any merger-related compensation or other benefit to be received by any director or senior executive, a statement of the merger valuation of the credit union, and a statement of whether any merger payment will be made to the members and how much of a payment will be distributed among members.
The question raised by these two current events, the growth in bank purchases and the Nationwide sale and other conversion precedents is why aren’t credit union being member-owners compensated today? When members are asked to approve the transfer and control of all their assets and common wealth to another credit union via merger, shouldn’t they be treated as least as well as when credit unions pay out bank owners?
Time to Take a Stand and Act
Its time for those who believe in a cooperative system to take a stand and ensure that intra-industry mergers reflect the same process and member-owner payments as every other credit union financial transaction requires.
Without change, the industry will be in a race to the bottom. As I described yesterday, one predatory credit union, PenFed, has cancelled 30 long serving credit union charters via merger between 2003 and 2022. Even as PenFed hits a financial stall, this activity is being imitated by others daily.
Credit unions want all the authorities and options to compete in the open financial markets, but not when it comes to their own brethren. These industry predators want the opportunities of the free market, but not the responsibility of transparent dealing and ownership reward when taking over another credit union.
These “off market” dealings are corrupting leaders, perverting normal financial practice and encouraging credit unions to go out and “roll up” their kindred in bigger and bigger combinations. This trend is subverting not just the traditional practice of market based firms, but driving a consolidation eliminating one of the most stratgic advantages of a credit union charter: local control, investment, relationships and community building.
Why can’t the Nationwide outcome be the standard for all credit union mergers as well. From the above event:
what can’t be thrown out ( of the outcome) is the premium on capital Nationwide Bank was willing to pay, that’s the potential model going forward.
Shouldn’t that be the model today for all change of control credit union transactions?
Pentagon FCU was approved to acquire its third credit union in the past six months, the $26 million Fort Hood Military FCU, in Fort Hood Texas, NCUA said Tuesday. That follows two December acquisitions for the $5.8billion credit union, those of $46 million Fort Shafter FCU in Hawaii and $13 million Coast Guard Employees FCU in Maryland.
This twenty year old description was before mergers of sound, long serving independent credit unions became much more widespread. A decade later credit union system CEO’s, consultants and regulators openly promoted these acquisitions as a quick and easy alternative to internal organic growth. After all isn’t success just a factor of size?
This industry competition for acquisitions was based on offering private personal inducements for CEO’s and senior managers. The practice became so blatant that in 2017 NCUA passed a rule to bring more transparency to the process. The rule didn’t slow the wheeling and dealing. It may have even legitimized these payoffs.
Now credit unions could routinely add wording to the required Notice and Disclosures of these payments and state that the regulators have approved the merger subject only to the member vote.
A Case Study Lookback
Two weeks ago I described the final step in PenFed’s 2021 merger with the $36 million Post Office Credit union in Madison, WI. In August 2024 PenFed announced the closing of its only office in Madison. Since the 1934 chartering, Post Office’s 3,153 members (at time of merger) had received personal service. No more.
I called this closure the final step in “asset stripping.” This is the practice in a takeover acquisition to maximize the profit and eliminate any future investment or expenses. All of Post Office’s resources, reserves, member accounts were transferred to the control of the Virginia based PenFed. There is no longer any local presence, nuance or leadership roles in the community. With this branch closure, all member relationships are now virtual and remote.
The Final Cashout
Last week the land and building of the former Post Office location were put up for sale.
An internal view.
When the merger occurred, Post Office’s call report showed these assets with a book value of $589,222. The real estate listing on September 17, 2024 had a list price of $1,260,000. This is an increase of $671,000 (113%) in the three and one half years since the merger. The net gain on sale all goes to PenFed as “other operating income.” This is the final liquidation step of this 90-year old credit union which had 22% net worth at the merger date.
All Gain, No Risks, Members Left Behind
Paying nothing in these acquisitions for total control of all of another credit union’s members’ net worth and reserves makes these takeovers a very profitable practice. Systematically stripping out all of the most valuable assets for maximum cash value puts the icing on the cake. No worry about local commitments or member and community relationships.
Such takeovers are a common strategy in for-profit companies. However in credit unions there is no acquisition cost, just a few crucial payouts to the CEO and perhaps, other senior executives whose approval and pitch to the Board is required. It is literally free assets for the taking.
This practice is becoming more widespread. It is self-immolation, a systematic institutional dismantling of the credit union system driven by greed and personal ambition, not member benefit.
In many situations today, the merger destroys the local advantages, loyalties and relationships that are the foundation for credit union’s success. The acquiring credit union’s field of membership, or market focus, has no center or rationale. There are no “network effects” for branding or service delivery that would create operational efficiencies. Most critically the headquarters and leadership is hundreds or thousands of miles away. Local familiarity is all lost.
The consequence of credit unions preying and suborning their fellow CEO’s and boards is systematically demolishing the credit union advantage at both a market level and in the public’s eye. The coop model is seen as no different from other financial options. Especially in an era when virtual relationships are available from all financial providers.
And a credit union’s values are the same as every other market participant. The winner takes all.
The rationale is that growth and size will guarantee success, an assumption frequently at odds with the facts and members’ experience. Size does not automatically correlate with efficiency, growth or other financial metrics let alone operational excellence.
The PenFed Merger Demolition Derby Takes Off Again
Penfed pulled back from the American Banker’s “binge” strategy during the initial years of this century. It should be noted that the three mergers listed in the article were all military bases. One could argue that these were natural affiliations consistent with with PenFed’s focus and traditional brand. In 2010 there was a single merger with the $11.6 million Tripler FCU in Hawaii. And then a lull until 2015.
The Merger Frenzy Begins
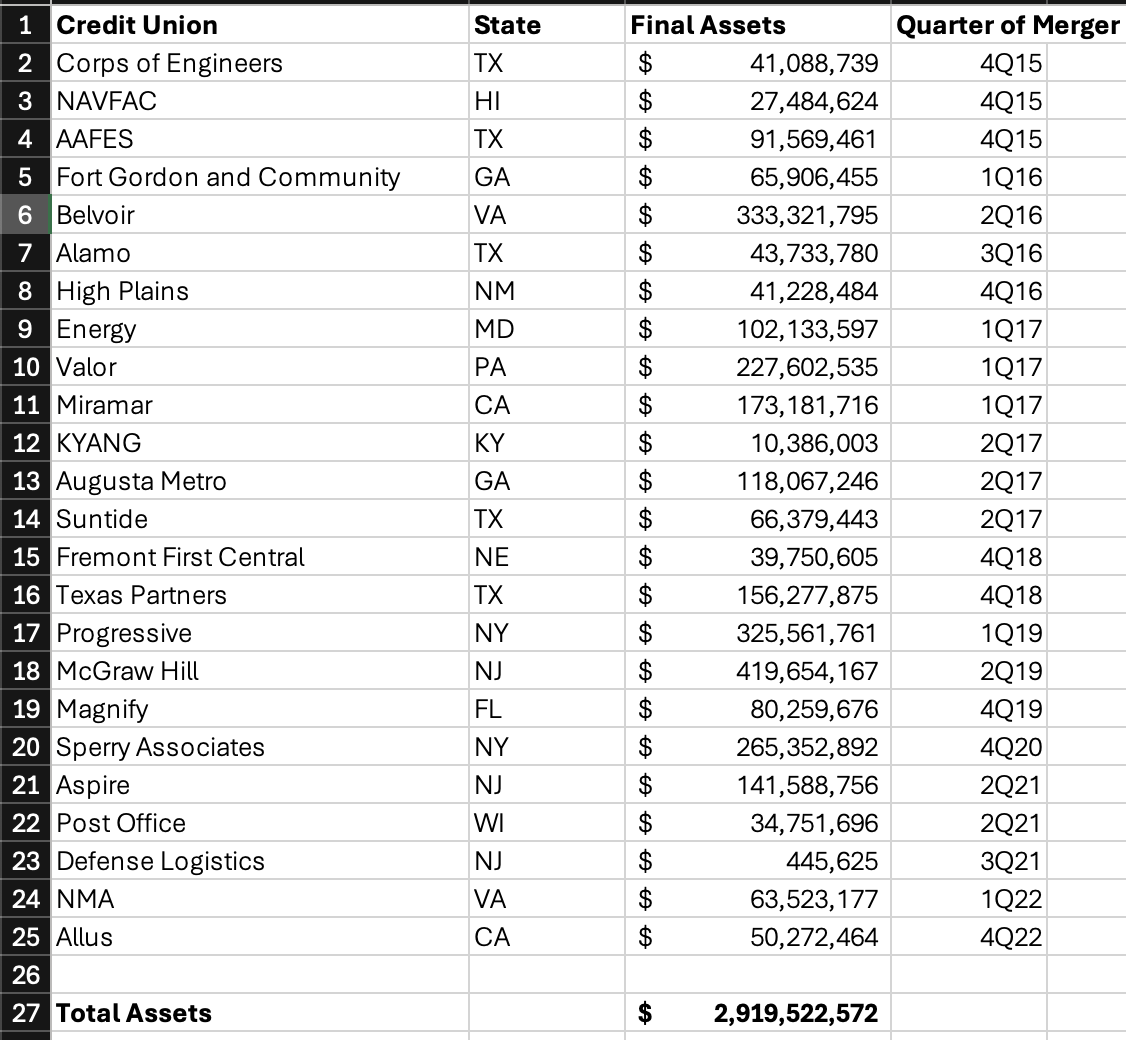
In 2015 PenFed undertook an aggressive acquisition campaign that lasted until 4Q 2022. They took over 25 credit unions located in 14 different states in under eight years. The majority had no military affiliation, such as Post Office, McGraw Hill, Sperry Associates and Progressive.
Progressive, a New York state charter with a single office focused on taxi medallion lending. This merger of a “troubled” institution resulted in a gain in the year acquired; more importantly it gave PenFed a field of membership open to anyone in America (the old Progressive state charter’s FOM).
The combined assets of these 25 acquisitions at the time of merger was almost $3.0 billion. As in Post Office’s example, control over all the assets, reserves, allowances and member relationships were transferred to PenFed’s head office. In some instances such as the very successful $265 million Perry Associates single office credit union, the office was closed immediately after the merger. The employees were let go, and all members forced into a virtual, remote service model.
Dismantling the Coop System
This systematic dismantling of credit unions and their successful local market positions is being emulated by other credit unions. The hunt is supported by a host of hanger’s on who benefit by facilitating this organized tear down of the cooperative alternative.
In many of the combinations below, the members, if a merger were really necessary, would have been better off with a local option familiar with their market and bringing real operational synergies. But in these private deal makings, the largest payoff to the CEO wins. And besides no one ever looks back to see what happened. Except for the members who begin to vote with their feet.
PenFed’s Eight Year Acquisition Spree
But Does It Work?
One could still ask however if the strategy works as a growth enhancement to normal organic tactics. When PenFed completed the final Allus acquisition in 4Q 2022, it reported total assets of $35.9 billion.
At June 2024, PenFed’s total assets were $33.5 billion. It would take more time to calculate all the other merger downsides such as local branches closed, the employees laid off and the number of members who left after being turned over to an organization with which they have no connection. In its initial merger frenzy, PenFed’s growth looked easy and free of any cost or risks.
However members soon see the asset stripping and the absence of local leadership. Moreover, PenFed lost every credit union’s most important strategic advantage: the hard earned, unique value of long lasting member relationships.
When CEO’s care more about themselves then they do for members’ well being, the difference that makes cooperatives successful is gone.
PenFed is not alone in its disruptive wasting of long standing successful cooperative charters. The question for those who believe in the unique role and purpose of cooperative design, is whether this faux capitalistic model becomes the norm for the system. Or like all false idols, will be defeated by the example of those who think the credit union model is first and foremost for members’ benefit, not managers or boards’ personal ambitions.
From the field. A recent story by a colleague working on site with a client.
I just wrapped up a meeting with a $6 billion CU that does a lot of indirect lending.
Used car values are falling.
Manufacturers are providing strong incentives for new vehicle purchases.
Some credit unions are desperate for income and are attracting business with below market rates via their indirect relationships.
The CFO shared that members with an expensive to own, drive, and insure car are going out and buying another car that is much cheaper to own, drive, and insure–both new and used models. But from a different funding source. For example, another credit union who will extend credit because the member’s credit score is still good, but about to take a nosedive.
The member knows they can’t afford to keep their existing vehicle. Then after they purchase the “cheaper to own” car, they bring the “expensive to own” vehicle to the credit union and hand over the keys.
The result is that the credit union is experiencing higher than expected losses because used car values are falling, and the cars being turned in are more expensive to own.
Long Story Short
The member lowers monthly payments and the cost to own a vehicle. The old car is turned back to the credit union. The member is unconcerned about how it impacts their credit score going forward.
The credit union has limited recourse because the “member” has just a “$5 savings account” required to join the credit union. (This is an indirect relationship only)
I am hopeful for a soft landing from this financial substitution scheme, but not everyone is on the same flight.
Two days ago CNBC host Kelly Evans in her periodic column The Exchange offered the following observations (excerpts):
“Owning real estate in the “sun belt” has probably been one of the greatest money-making opportunities of the past twenty or thirty years. And Covid, and the rise of remote work, has only accelerated all of that.
“Or has it? The San Francisco Fed just put out a new study suggesting that it could be the “End of an Era” for the snow-belt-to-sun-belt migration which has been the distinctive feature of U.S. population shifts over the past 50 years. Their argument? The South is getting too hot.
“It may sound like a reach, but their data on population shifts is worth considering. It shows many more parts of the sun belt losing population from 2010 through 2020 than in prior decades. Places in particular like Western Texas and Louisiana. (Although Florida–experiencing an influx of New Yorkers in recent years–remains an exception.)
“The U.S. population is starting to migrate away from areas increasingly exposed to extreme heat days,” the researchers write, “toward historically colder areas, which are becoming more attractive as extreme cold days become increasingly rare.” Cities like Baton Rouge, Jackson (Mississippi), Shreveport, Garland (Texas); and Long Beach (California) stand out as seeing population declines both pre- and post-pandemic, according to Census figures.
“Even Phoenix’s population growth has been slowing. By last year, it grew just 0.4%–a quarter of the growth rate it enjoyed pre-pandemic. Houston saw big declines in 2021. . .
“The Midwest could be a big beneficiary of a re-shift. “Markets that are more affordable, that are enjoying 80-degree summers while other people are boiling, might become a lot more attractive–like Cleveland,” real estate expert Ivy Zelman says, which could be one market in particular to watch.
“On top of the heat and storms, sun belt populations are also grappling with issues like soaring home insurance premiums (in Florida), or flood insurance premiums (in Louisiana). Real estate prices have also risen significantly in recent years, negating a big part of the cost savings in relocating from the north.
“And you know what? New Jersey (where author Kelly lives) is lovely, actually. The towns are small and walkable. Errands are all pretty close. The hospital I had my kids at was seven minutes away. Some towns even pick up your trash from the backyard! And being close to Manhattan is a pretty nice perk. Last year was the first year since 2010 that the state actually saw positive net migration.
“If by some twist of fate this continues, parts of the country that were previously left for dead might be the biggest economic beneficiaries in years to come.”
Strategic Assumptions Turned Upside Down
A significant credit union advantage has been their local roots. This is partly a function of the field of membership and initial sponsor support; partly the limits of capital; but mostly because this market focus and knowledge created a major strategic advantage over much larger, often out-of-area competitors.
Local meant being part of the community with loyalty passed down through generations. Then multiple economic shocks and changing regulatory options provided credit unions opportunities to move beyond their historical boundaries. Select employee groups, multiple counties and even whole states defined new market potential.
After the financial crisis in 2008/09 some credit unions began to seek out of state expansions to diversify beyond their local economy into more appealing growth markets.
A major focus was the sunbelt states, especially Florida. Florida has no state income tax, strong growth, favorable weather and is a retirement destination for credit union executives from the colder states in the northeast and Midwest.
Since 2015, investments via bank purchases, mergers and some new branches have been made by out of state credit unions. Here is a current estimate of the totals of this activity in Florida by the home state of these “foreign” credit union expansions:
Florida’s Out of State Credit Union Branches
CUs
Branches
AL
2
6
CA
3
11
GA
2
2
ID
1
1
IL
1
2
MI
2
26
MN
2
2
MO
1
3
NC
1
8
NY
2
2
PA
1
1
TX
2
7
VA
3
36
Totals 23 107
These 107 branches are 10% of the 1,045 credit union locations in the state.
Some of these locations undoubtedly serve existing FOM’s such as Navy, Pentagon, and Walt Disney World. But many represent investments to diversify from cold weather states to warmer climes as in the case of the 26 Michigan branches.
In Nevada, 25 credit unions manage 120 branches. Of these totals, 11 credit unios are from out of state and manage 50 of the in-person locations. Mountain American based in Utah has the most branches in the state.
Now Climate Change
While the economic outlook, warmer weather and personal tax advantages may cause Florida and Nevada to appear as attractive expansion opportunities, managing a single branch or small system away from the home office market is a challenge. The network effects from expansion in adjacent markets are lacking. There is no brand awareness or legacy reputation in these new locations. Any existing members may live in the area only temporarily.
Are these out of state, diversification outposts hundreds or thousands of miles from a credit union’s primary service area worth it? What is the ROA of these investments?
Might more stable and innovative future growth now be in areas around major cities in the northeast and midwest such as Detroit, Cleveland, Toledo, Buffalo. Grand Rapids, Milwaukee? Will local and national infrastructure investment and less extreme climate now make these THE future growth markets?
Is a compilation of “odd lot” branches around the country via mergers or occasional bank purchases a coherent strategy or merely ambition ungrounded by reality?
As the 80th Anniversary of the June 6, 1944 Allied landings at Normandy draws to a close, we listen with great interest to the living participants’ stories of that consequential event. They did their part. Now it is up to us that their examples of duty, service and honor be carried forward for freedom’s fight
One might also ask about the state of the credit union experiment at this time. Are there any lessons relevant for today from four score years ago? What examples might inspire current cooperative leaders?
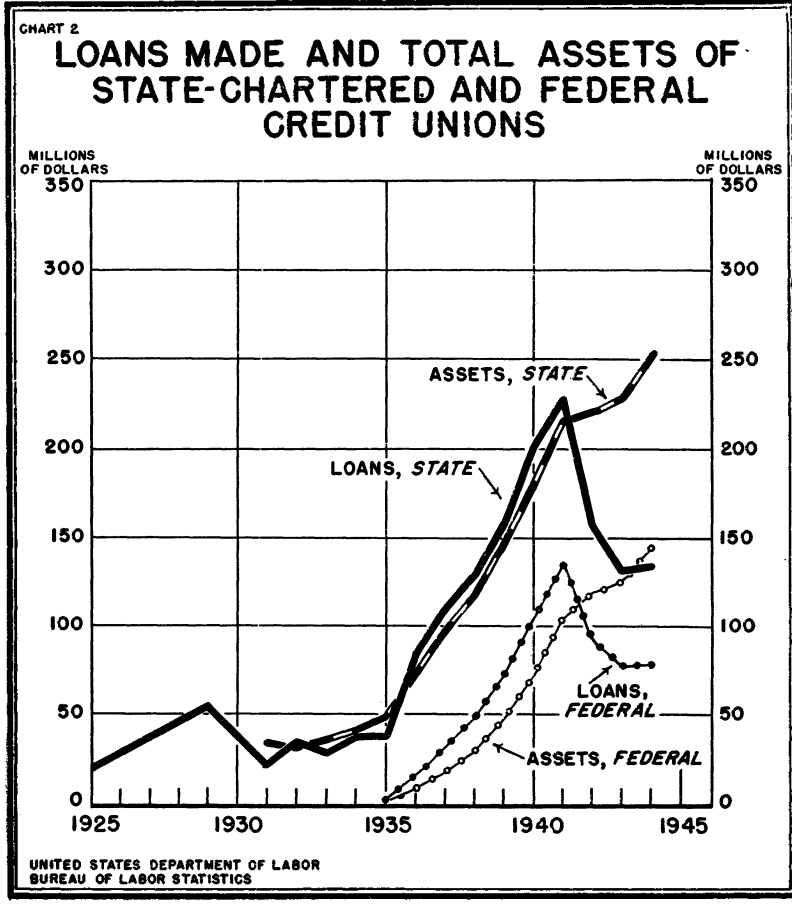
The first surprise is that there is a very comprehensive analysis on the cooperative system including details that are directly relevant for today’s priorities. The source for this information is Bulletin #850, from the Department of Labor titled: Activities of Credit Unions in 1944.
This 16 page report contains historical tables, state and federal totals for numbers of credit unions, total assets and members, number of loans made and dollar amounts outstanding in each state and for national totals. One table records the number of state and federal charters that are active from 1925 through 1944. The cost of the report was just five cents.
Observations on 1944 Credit Union Trends
The impact of the war on credit union lending is central in this analysis:
The entry of the United States into the war was followed by a sharp decline in the credit union movement. Many associations were liquidated, membership fell off, and credit union loans showed a precipitous drop.
This was caused by a number of factors. Among them were the issuance by the Federal Reserve Board of Regulation W (limiting to 18 months—later to 12 months—the period of repayment of installment purchases or loans made for that purpose), the disappearance from the market of higher-priced consumer goods (automobiles, refrigerators, etc.) for which many credit union loans had previously been made, the restrictions on the use of building materials, the emphasis on repayment of debts and the inadvisability of incurring new obligations of that nature, and the increased wartime earnings of wage earners which resulted in a lessened need for credit.
However, some trends were looking better:
Reversing a trend that has been sharply downward since the beginning of the war, both the membership and business of credit unions showed an increase in 1944, although the number of associations was smaller than in 1943.
At the end of 1944 the number of associations on the register totaled 9,099, as compared with 10,373 in 1943. The 8,702 associations active and reporting for 1944 had 3,027,694 members and made loans aggregating $212,305,479. These represented increases, as compared with 1943, of 0.1 percent in members and 1.7 percent in loans.
Total assets which have continued to increase all through the war years, even while number of associations, membership, and business were declining, mounted to $397,929,814, or 12.0 percent above 1943.
The Bulletin also provides a brief history of credit union chartering. Here is one excerpt:
. . .in 1934, therefore, a credit union act was passed by the Congress of the United States and the Credit Union Division was created in the Farm Credit Administration to oversee the carrying out of the law and render various services to the associations formed under it.
From that time onward, until checked by wartime conditions, the credit union movement expanded at an accelerated pace. Not only did the associations with Federal charters spring up and grow, but the older State-chartered movement also seemed to be stimulated to growth considerably faster than its previous pace. The rate of growth of the Federal credit unions, however, was consistently higher than that of the State-chartered associations, and by the end of 1944 the Federal credit unions accounted for 43.1 percent of the members, 36.9 percent of the loans made, and 36.3 percent of the total assets of the credit union movement.
The FDIC Supervises
In 1942 the federal Credit Union Division which was first placed under the Farm Credit Administration was transferred to the FDIC. The FDIC administered the Federal Act but did not insure credit unions, only banks.
What makes the financial details in this report so remarkable is that the totals for the 9,099 credit unions were all maintained by hand. Credit unions used only hand posted card ledgers and total tapes run on mechanical adding machines. There were no databases for quick comparisons, summaries and trends. Given these conditions, the report’s historical tables and graphs are even more remarkable for their thoroughness and timeliness. (the Bulletin is dated October 16, 1945)
The Status of Negro Credit Unions
One of the most enlightening analysis is under a section called Experience of Federal Credit Unions. Here are the details:
The Federal Credit Union Division of the Federal Deposit Insurance Corporation has made available to the Bureau of Labor Statistics certain information on Negro credit unions and on all liquidations of associations organized under the Federal Credit Union Act. Unfortunately, similar data are not available for the State associations.
Negro credit unions
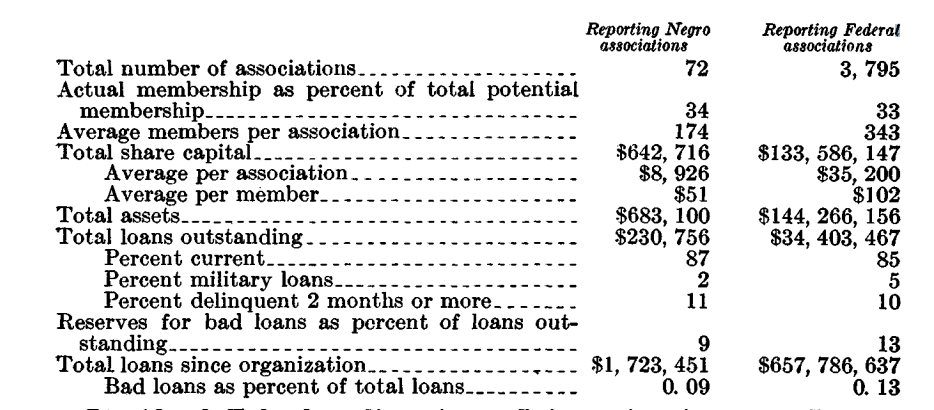
By the end of 1944 a total of 91 credit unions had been organized, under the Federal Act, among Negroes. Of these, 74, or 81 percent, were in active operation at the end of the year, and the remainder were inoperative or had had their charters canceled. For the entire group of Federal credit unions 74 percent were active.
The following tabulation compares the 72 Negro associations for which data were available with the whole group of 3,795 reporting Federal credit unions. As it indicates, the Negro associations, although smaller than the average for all Federal credit unions and less well financed, were holding their own very well and even excelled the showing of the whole group as regards bad loans that had to be written.
Liquidation Information
Information for 1,109 Federal credit unions that were discontinued during the period from June 26, 1934, through 1944 indicates that the liquidated associations were in the main small. Over a third had share capital amounting to less than $500, and 68 percent less than $2,000. Only 18 (1.6 percent) had capital amounting to $20,000 or more.
Of the 1,109 credit unions, 785 (71 percent) returned to the members all of the share capital they had invested and some paid back even more; altogether the members of this group of associations received back $164,955 (or an average of about $2.60 per member) more than they had put into the organization.
The members of the 234 associations that paid less than 100 cents per dollar of share capital sustained an aggregate loss of $20,889 (about $2 per member). Some 65 percent of this loss was accounted for by the associations with capital of $2,000 or less, and 97 percent by those with capital of $5,000 or less.
Sixty-three percent of all cancellations, mergers, and revocations of charter made in the 9 ½ year period took place during the war years of 1942-44.
What This Report Reminds Today
This remarkably candid and thorough report concludes with two pages of updates on Developments in the Credit Union Movement in 1944. This section describes changes in league and CUNA organization and in state chartering regulations.
In just a few pages one finds an important factual and analytical record of the emerging credit union system by 1944. In wartime we rightly honor the contributions and sacrifices of all who serve. How in moments of extreme challenge, ordinary people do extraordinary deeds.
But these same contributions occur on the home fronts, unheralded and frequently taken for granted by their successors. This unique Bulletin is a valuable document about the early contributions of the founders of the credit union system. It is their efforts and commitment, the seeds they planted, that created the foundation on which today’s credit unions built their success.
Ordinary people doing extraordinary things for their communities in the past, now and into the future.
Callahan’s May Trendwatch with first quarter 2024 data opened with an economic update from Alloya Corporate Federal Credit Union.
This opening analysis was one of the most thorough, well documented presentations on macro economic issues, credit union trends and Alloya’s own recent financial experience I have seen.
Todd Adams, CEO and Andy Kohl, Chief Investment Officer were the presenters of over 20 slides. They covered trends in consumer spending, interest rate volatility and future outlooks. They showed how Alloya navigated the dramatic inflows and then liquidity shortfalls in 2022/2023.
Below I excerpt several slides to provide examples of their analysis. The full Trendwatch slide deck from May 14 can be accessed from Callahans here.
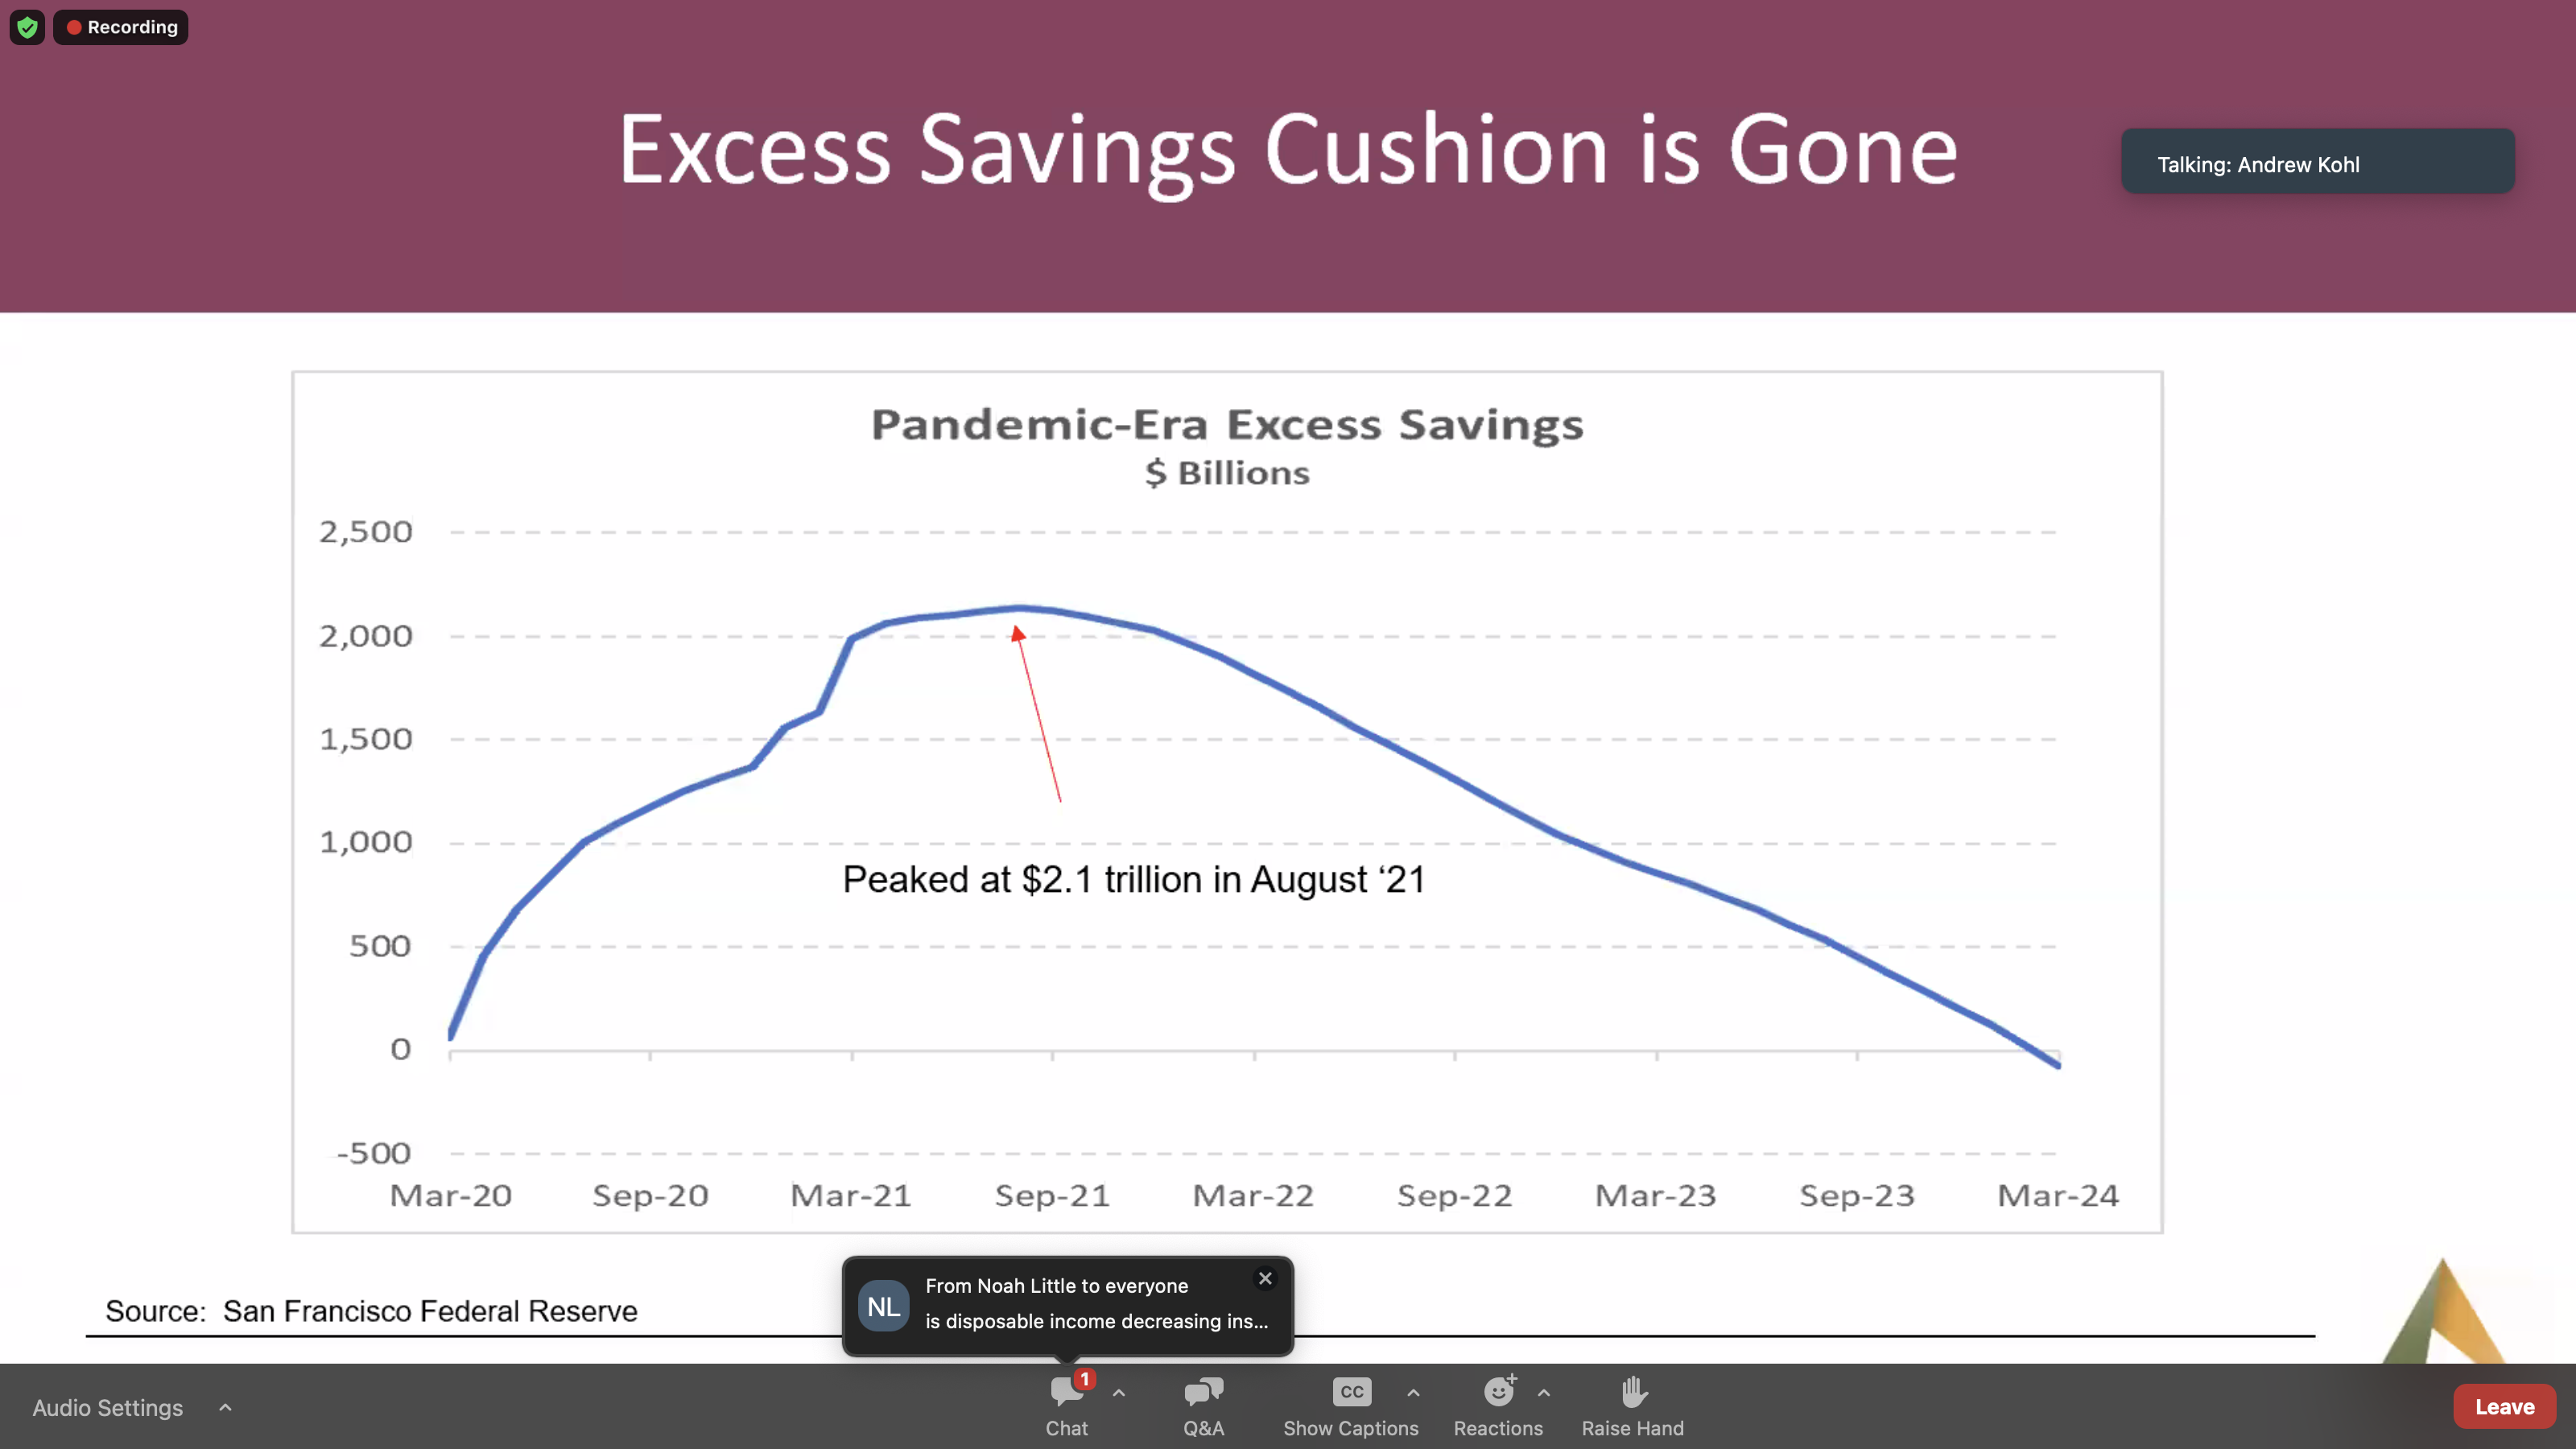
A key macro economic trend
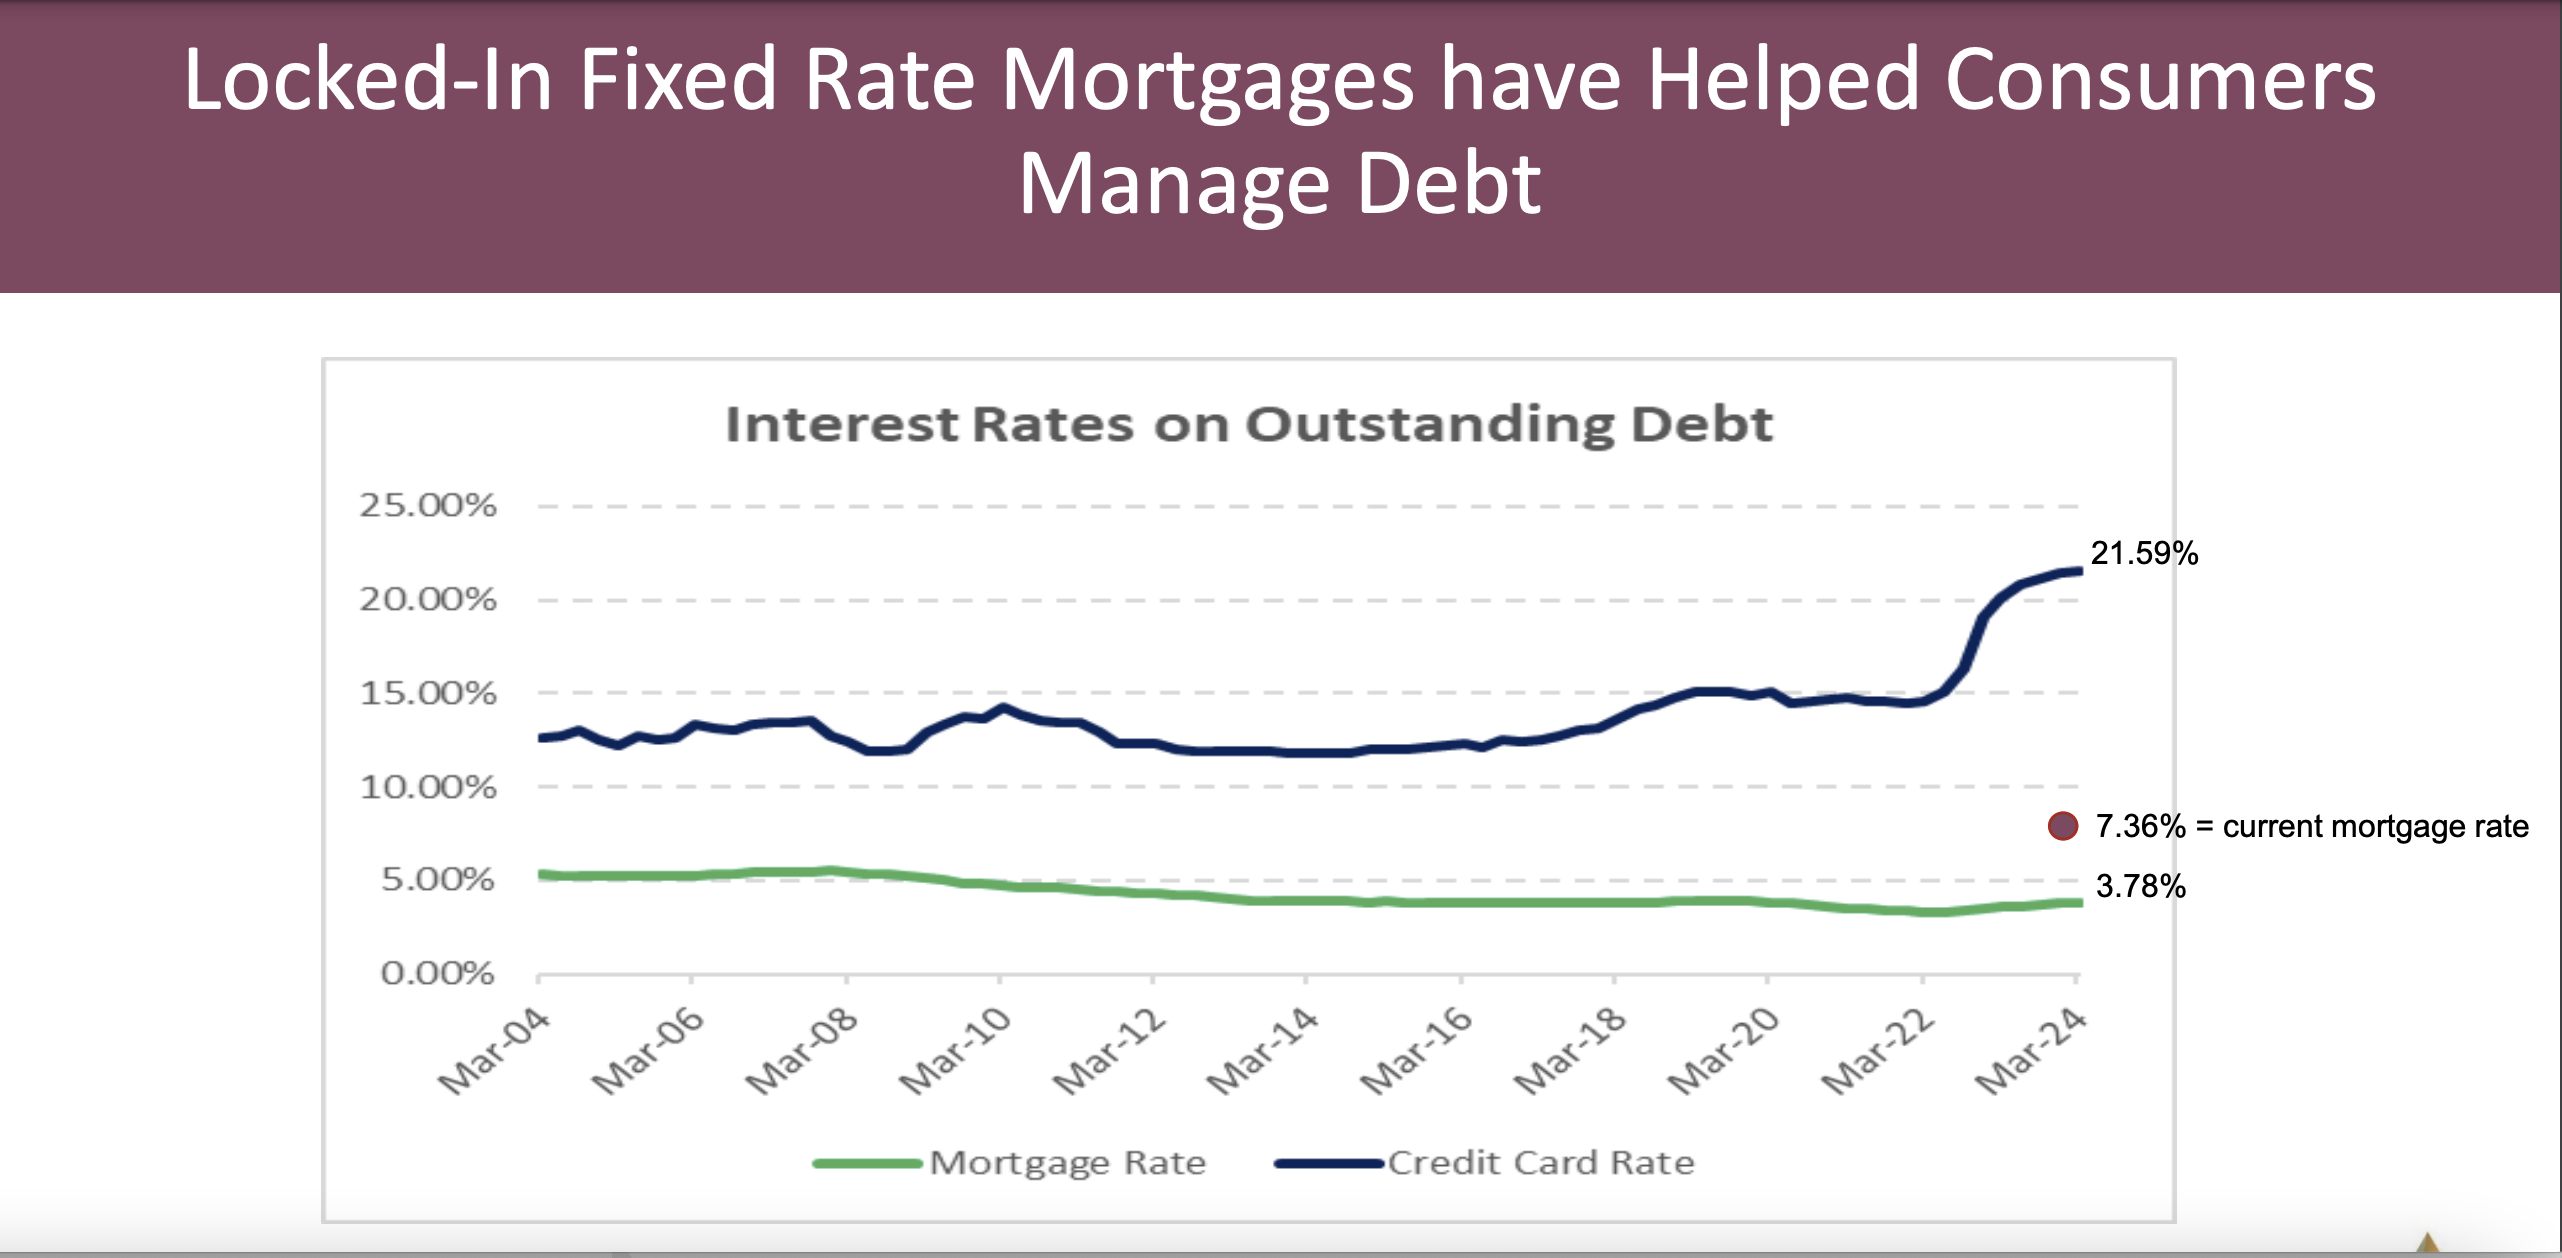
The mortgage fixed interest rate advantage
Lower income groups most affected by price increases
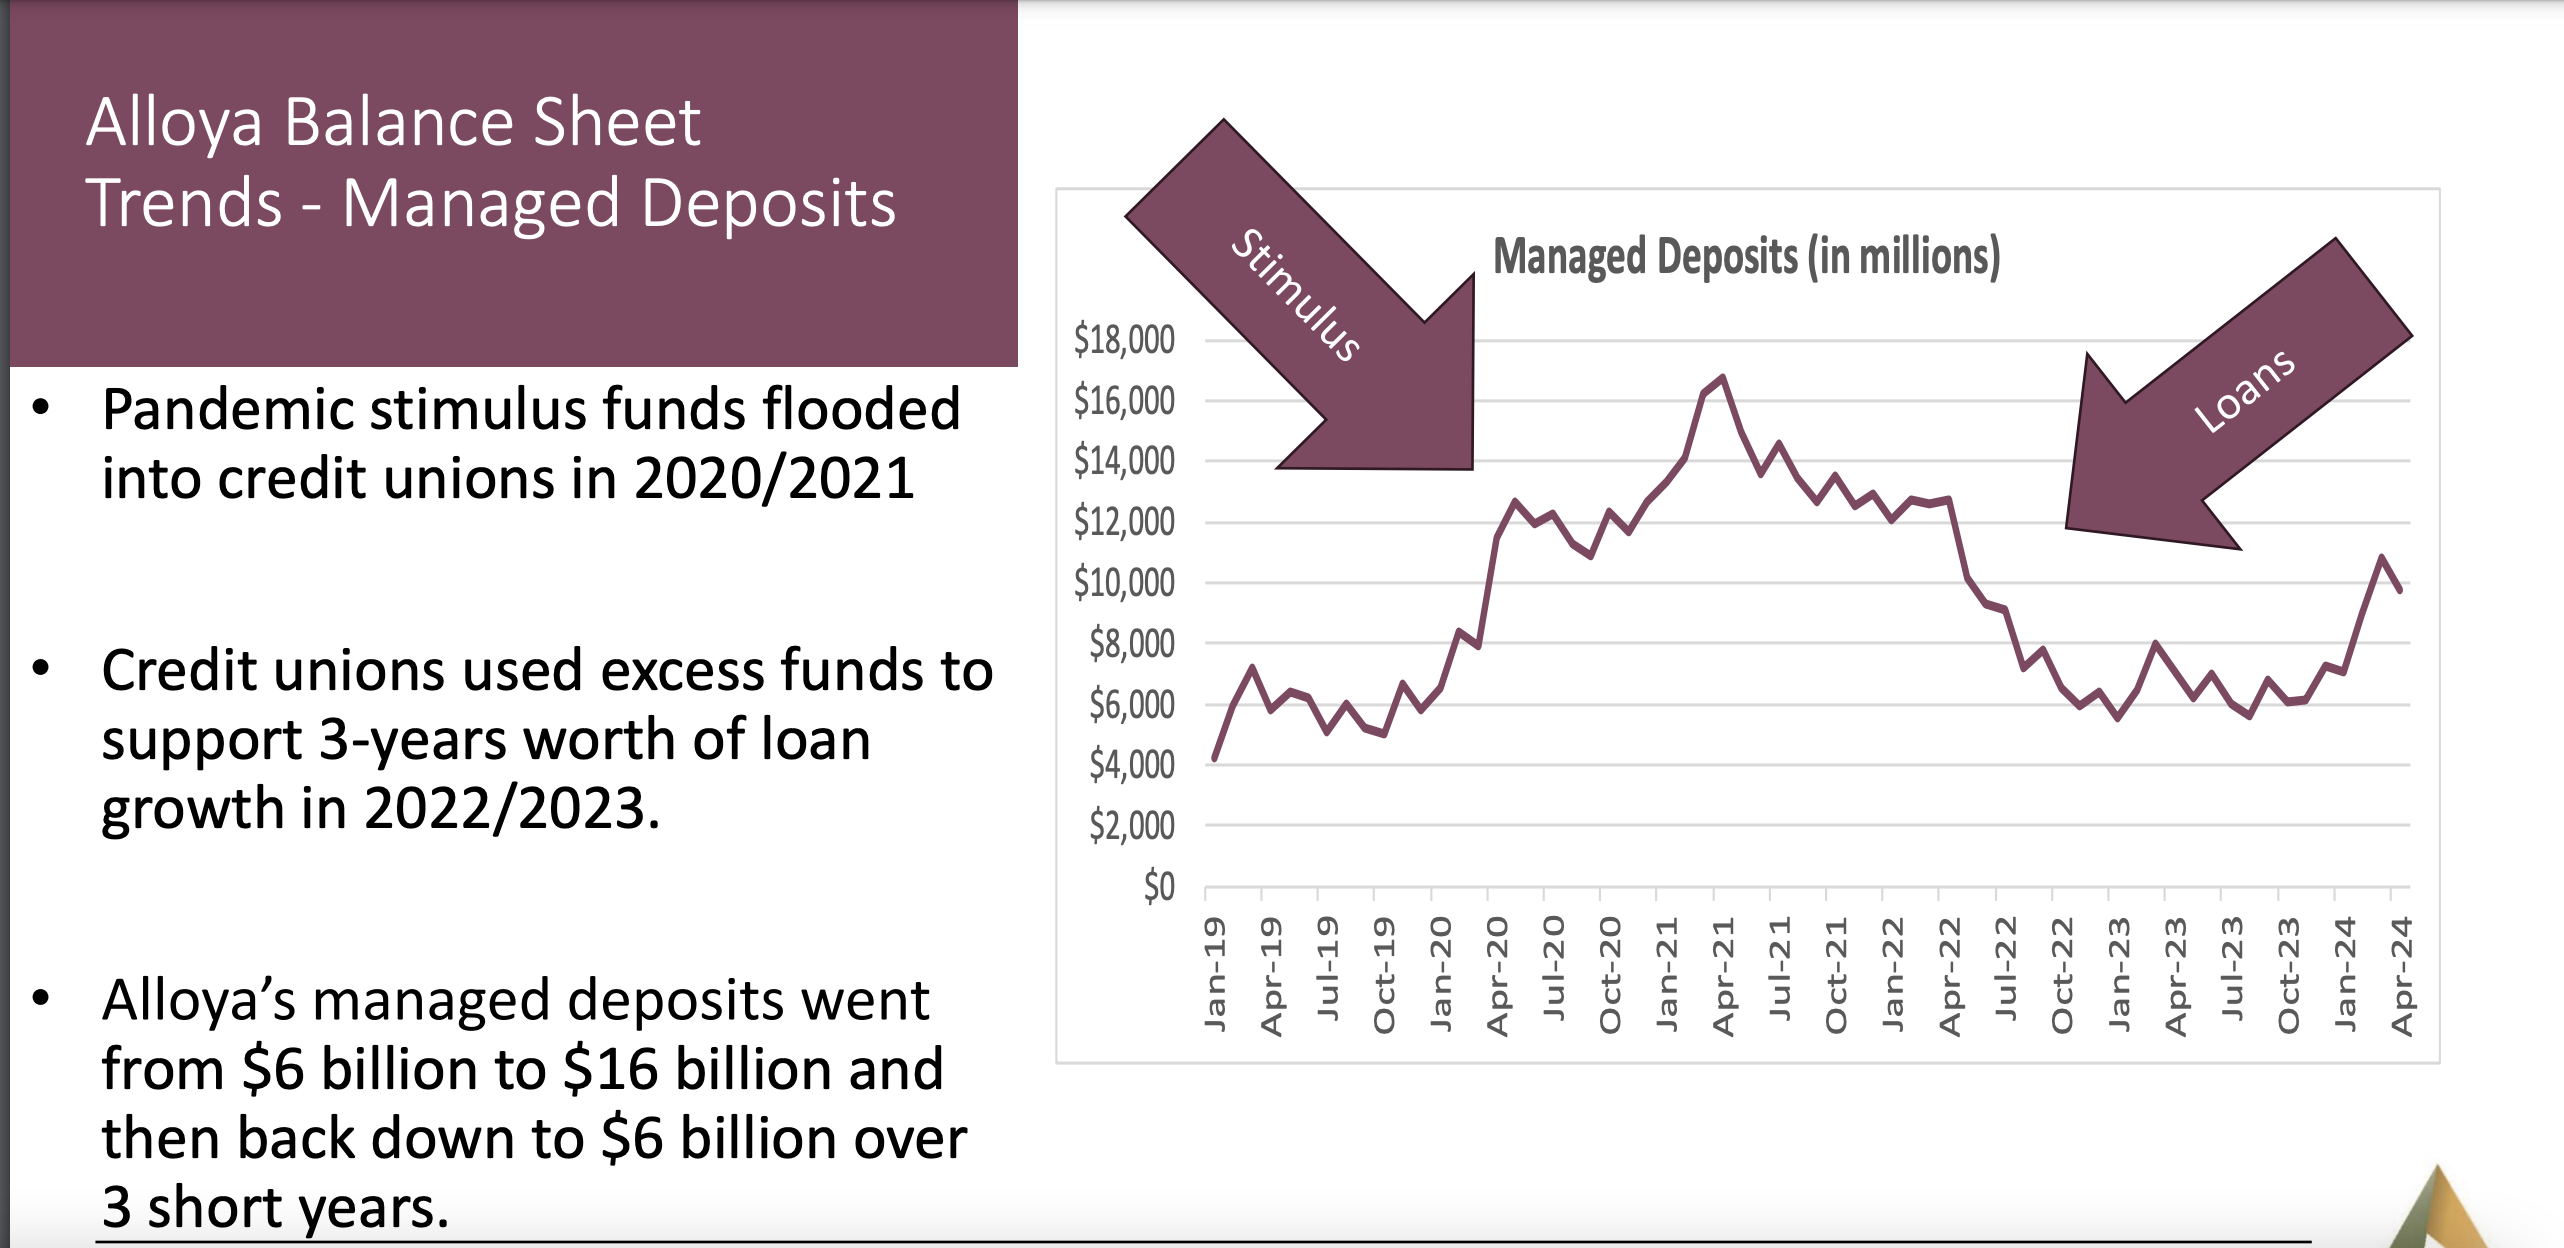
Alloya’s balance sheet flows 12/19 to 4/24
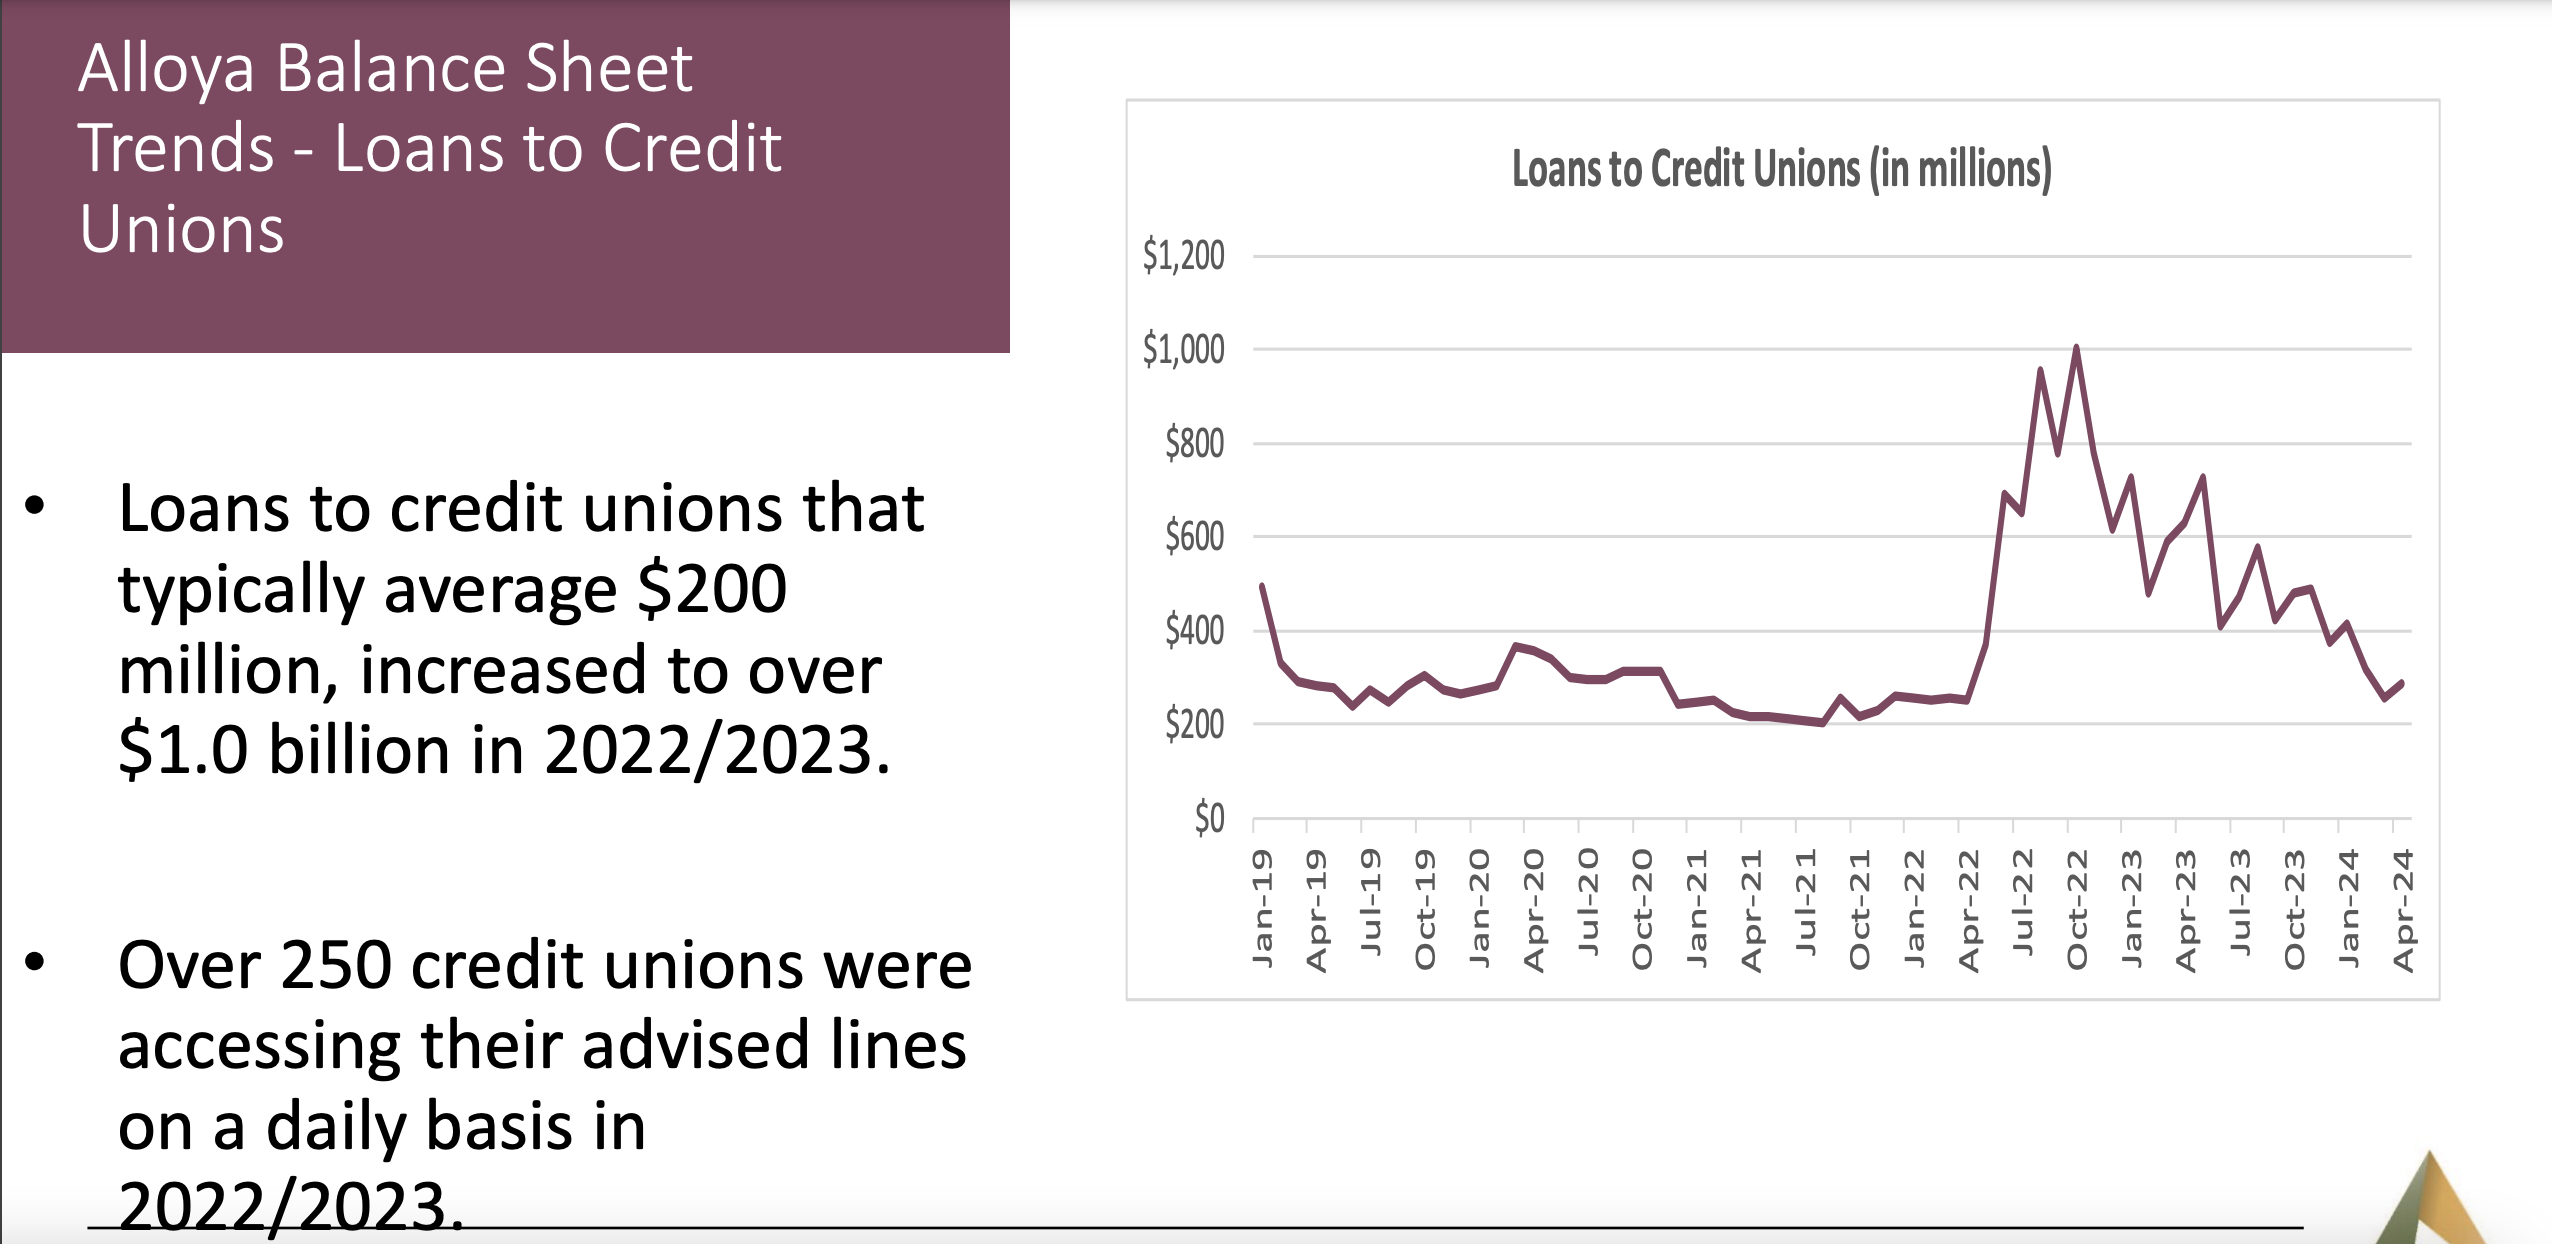
Alloya’s lending to members in 2022/2023
The outlook for short term rates. A Fed Funds of 2.5%?
So that you don’t overlook the rest of the industry analysis, here is Callahan’s opening slide on credit union’s core balance sheet growth trends as of March 31, 2024 versus one year earlier.
With the help of a young progressive, attorney Willard King, and several years efforts, the Illinois General Assembly passed the first Illinois Credit Union Act in 1925.
The Act’s purpose was “to safeguard the monetary deposits and other financial instruments of Illinois credit union members” through a system of supervision and regulation.
Bucky Sebastian was the internal counsel for the Illinois Department of Financial Institutions (DFI) from 1977-1981. One DFI responsibility was to charter and supervise the largest number of credit unions of any state system. At yearend 1977 there were 1,095 Illinois charters, managing $1.8 billion in assets for 1,274,732 members.
Sebastian and King became good friends discussing the legal history of the Illinois credit union system and their shared interest in the life of Abraham Lincoln.
In 1977 the bankers were challenging the Department’s authority to permit share draft (checking) accounts for Illinois state charters. There were also initial thoughts about how to update the Act to respond to deregulation. King’s knowledge of prior credit union legal changes was very useful in understanding the legislative politics for coops.
One of the stories King told was overcoming the opposition from established commercial and financial interests in 1925 to the new credit union option. King shared the position of the Chicago Association of Commerce which was: “This is a bill to permit a lot of ordinary people such as blacksmiths and bricklayers to go into the banking business, where they will certainly lose their money.”
To answer how long credit unions have been opposed by banking interests, there is a simple reply: Forever.
In following up an article by David Bauman in which he referenced his FOIA request to NCUA, I was directed to NCUA’s FOIA Library.
Under the Frequently Requested Information section was what I had asked for: NCUA’s response to Congressman French Hill on December 14, 2023. Other items in this section included previous multiple requests that can be accessed by just clicking on the link.
Another section of the Library was the FOIA Request Logs which include 474 requests going back to 2019. I scanned the requests that were open and closed for 2023 to see what information had been asked for.
The log table has the date of the request, sometimes the organization, a description of the information sought and final disposition: granted-partial or full, denied, or “no records” responsive to the request.
I have reached out to NCUA to ask if anyone can use the FOIA log number to review previous responses without having to submit a whole new request—just to learn about the agency’s response. When the reply is received, I will add to this blog.
In the meantime here are some of the more intriguing request descriptions, all of which were filled in whole or in part.
Selected Titles In the FOIA Library from 2023
Copies of all FOIA appeal logs by year from 2010
Records sufficient to identify all employees who entered into a position at the agency as a Political Appointee since January 20, 2021, to the date this records request is processed, to include a list of enumerated parameters to include resumes and waivers.
Documents and data sufficient to account for the monthly occupancy or vacancy rates for the agency’s five largest buildings (measured by square footage) from January 1, 2020, to December 31, 2022.
A list of federally insured credit unions with agricultural loan portfolios greater than $100 million.
The application, approval, and any attached materials from the most recent field of membership change by Thrivent Federal Credit Union, headquartered in Appleton, WI.
A copy of the charter for NBC (N.Y.) Employees Federal Credit Union, charter 22351, prior to its merger into XCEL Federal Credit Union, charter 16218.
A list of nationally insured credit unions that have failed and/or been acquired since January 2001 to include credit union name, charter number, opening date, failure date, and acquiring institution.
The most recent NCUA salary data.
1)The number of federal credit union mergers completed each year between 1980 to 2020; and 2) The number of active federal credit union charters each year from 1980 to 2020 (as of 12/31 or other uniform date for each year). Note: If information is not available going back to 1980, please provide information going back as far as NCUA records allow.
A list of all credit union CEOs and volunteers as of March 31, 2023.
NCUA salary data specifically under the category of political appointee.
Quarterly lists of all credit union board members for each quarter from Q42012 through Q42022.
1)Field of membership (“FOM”) criteria and approval documentation for FirefightersFirst Federal Credit Union (“Firefighters”); 2) Firefighters’ application and documents related to add “employees of non-profit foundations authorized by their organizing documents to be for the benefit and support of firefighters” (“Foundation”) to its FOM; 3) OGC’s legal opinion and analysis that supports the addition of the Foundation to Firefighters’ FOM; 4) CURE’s office summary that supports the addition of the Foundation to Firefighters’ FOM; 5) CURE’s approval letter and GENISIS worksheets reflecting approval of the Foundation to Firefighters’ FOM.
Entire consumer complaint file from 2013.
An Important Resource
This is a partial 2023 listing. In addition to some interesting reading, it also shows the agency as a resource for names of CEO’s and volunteers (including even CUNA and NAFCU) and for credit union data or other files going back years.
There might even be some valuable credit union press stories in following up some of these past requests.