
Wisdom of the crowd is a theory that assumes large crowds are collectively smarter than individual experts. It believes that the collective knowledge and opinions of a group are better at decision-making, problem-solving, and innovating than an individual or single organization.
The collective judgment of a diverse group compensates for the bias of a small group.
On September 2, Credit Union Times published an analysis by Callahan’s Jay Johnson of credit union investment trends at June 2022. How did the industry respond to 2022’s rise in market rates?
Investments 30.5% of Total Assets
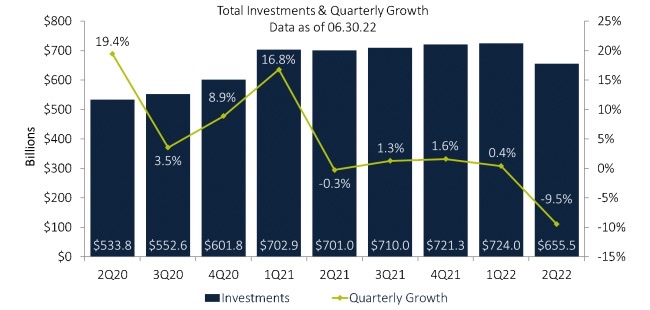
Total investments held by credit unions, including cash balances, fell 9.5%, or $68.6 billion. But the June total $655.5 billion was still 30.5% of the balance sheet.
As reported in the article, credit union investments boomed in the past two years, growing from $389.3 billion in December 2019 to a high of $724.0 billion in March 2022, mostly by Covid relief payments held as cash. Even after this quarter’s decline, total investments are well above where they stood at the start of the pandemic.
 Credit Unions Favor the Front of the Curve
Johnson’s analysis reported the trends in market rates at quarter end as follows:
“The yield curve flattened after the Fed raised rates 75 bps in both June and July. Short-term Treasuries, which are most sensitive to Fed action, priced in expectations for additional rate hikes. The two-year yield increased 40 basis points in June after some dramatic intra-month swings. It settled at 2.95% at month end after reaching as high as 3.45%.
“The market struggled to price in both recession risk and more Fed rate increases at the same time, as the two forces counteract each other. The 2-year/10-year spread finished the month at 6 basis points, threatening inversion.
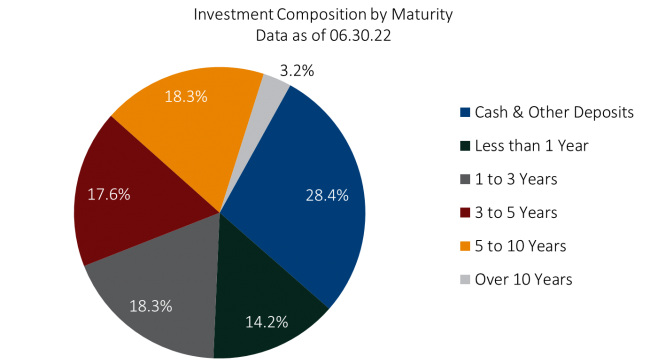
“Portfolio allocators took advantage of the increase in shorter-term yields and reinvested funds into securities of more near-term maturity. The one-to-three-year maturity category took in $4.2 billion from credit union investors since March, good for a 3.6% increase and enough to become the largest non-cash category.
“Investments in securities are spread relatively evenly across each of the maturity categories within the one-to-10-year range, understandable given recent changes to the yield curve. Cash comprises 28.3% of total investments.”
Portfolio Yield up 21 Basis Points
“The average yield on investments increased 21 basis points quarter-over-quarter, up to 1.12% through June. While this marked the fifth straight quarterly increase, it was the most significant change in yield since the first quarter of 2019.
“Of course, with rising yields come unrealized losses on available-for-sale securities, and these, perhaps temporary, losses now total $28.3 billion throughout the industry.”
A Crowd Sourced Benchmark for WAM and Investment’s NEV Risk
As shown below 42.6% of credit union investments are cash or under one year maturity. Obviously it is difficult to reposition longer maturities as rates rise, without incurring a loss. This short-term liquidity build up allows credit unions to “ride the yield curve up” as rates are taken to a new normal by the Fed in its inflation fight.
The overall weighted average investment maturity for all credit unions is 2.83 years. Every institution’s balance sheet, cash flow and business priorities are different.
The 2.83 years is the risk profile of the total credit union portfolio. It is based on 4,900 independent decisions about managing risk as measured by WAM at the end of June.
Individual credit union investments may have a longer or shorter WAM. But this is the “collective wisdom” at this point in the upward rate cycle as the Fed tries to rein in the highest inflation in four decades.
Total Balance Sheet Analysis
Investments are one component of overall balance sheet risk management. In addition to NEV calculations, credit unions use net interest income (NII) simulations to project possible outcomes for net income in changing rate scenarios.
NII is a comprehensive look at the repricing of assets and cost of funds. The June data showed that the industry’s net interest margin improved in the latest quarter.
Rising market rates will lead to increased cost of funds. The ALM challenge is to manage this adjustment in tandem with the repricing of both investments and loan assets. So far, so good.
While market “narratives” about future rate hikes can vary daily, the overwhelming consensus about future Fed moves is “higher for longer.”
Investments are just one aspect of interest rate risk management. For this component, how would your portfolio’s risk profile and recent decisions compare with the industry’s collective wisdom?