Two Positive Updates & a Disheartening Decision

Callahan’s Trend Watch industry analysis on February 15 was a very informative event. It was timely and comprehensive.

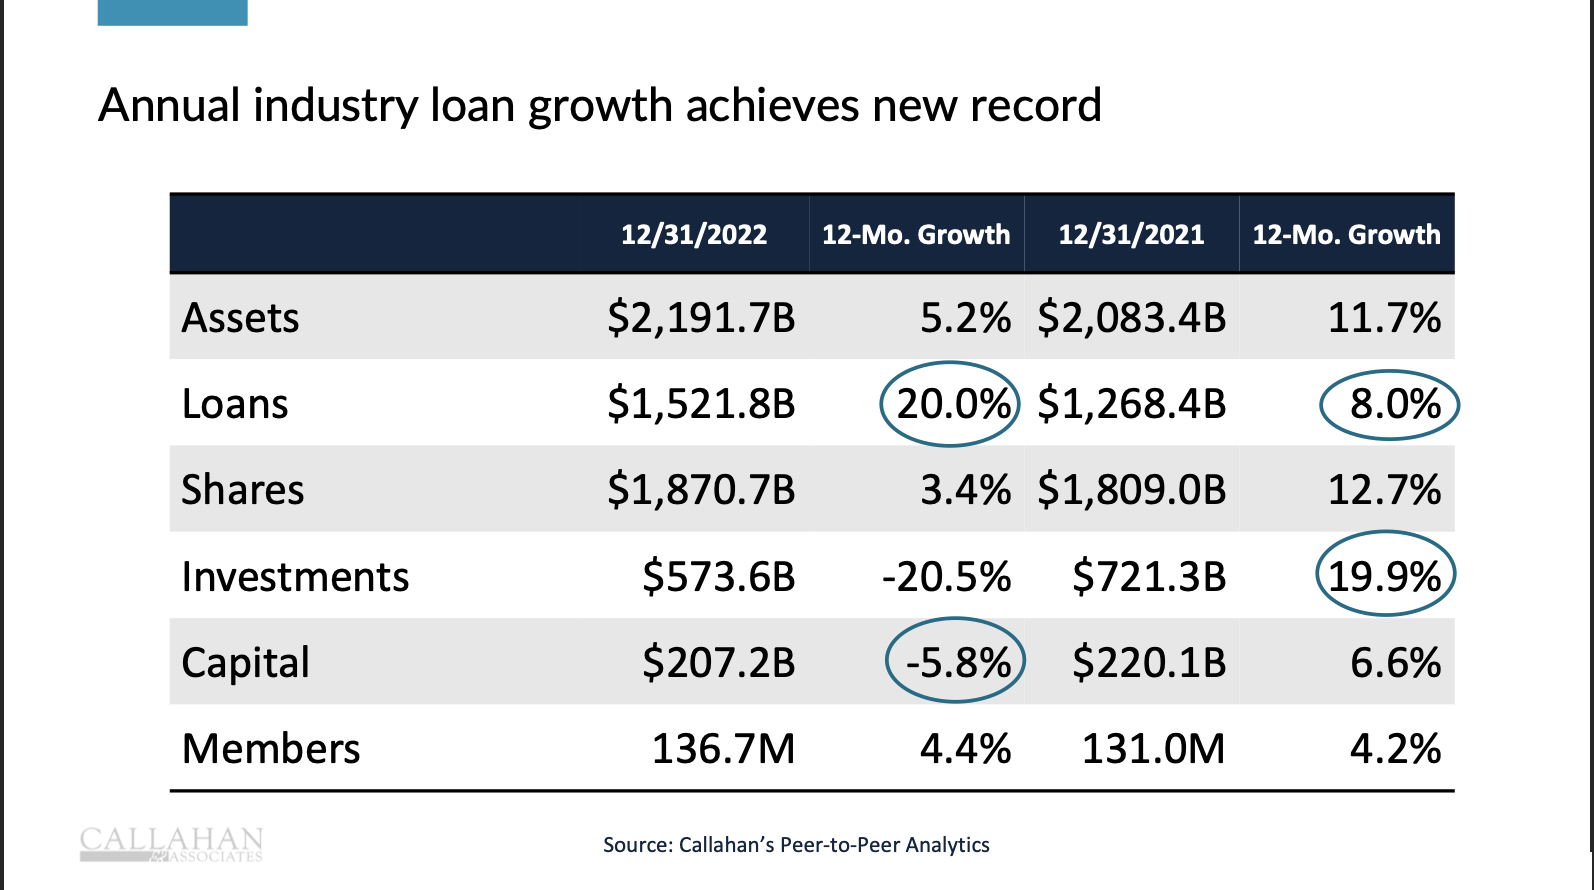
Here is the industry summary slide:

The numbers I believe most important in the presentation are the 3.4% share growth, the 20% on balance sheet loan growth and the ROA of .89.

The full 66 slide deck with the opening economic assessment and credit union case study can be found here.

The Theme of Tighter Liquidity

A theme woven throughout the five-part financial analysis was tighter liquidity and the increased competition for savings.   Slides documented the rising loan-to-share ratio, the drawdown of investments and cash, the increase of FHLB borrowings, and the continuing high level of loan originations, but lower secondary market sales.

These are all valid points.   However liquidity constraints are rarely fatal.  It most often just means slower than normal balance sheet growth. That is the intent of the Federal Reserve’s policy of raising  rates.

Credit Unions’ Advantage

I think the most important response to this tightening liquidity is slide no. 24 which shows the share composition of the industry.  Core deposits of regular shares and share drafts are 58.3% of funding.  When money market savings are added the total is 80%.

This local, consumer-based funding strategy is credit unions’ most important strategic advantage versus larger institutions.  Those firms rely on wholesale funds, large commercial or municipal deposits and regularly  move between funding options to maintain net interest margins.  These firms are at the mercy of market rates because they lack local franchises.

In contrast, most credit unions have average core deposit lives from ALM modeling of over ten years. The rates paid on these relationship based deposits rise more slowly and shield institutions from the extreme impacts of rapid rate increases.   In fact the industry’s net interest margin rose in the final quarter to 2.86% (slide 56) and is now higher than the average operating expense ratio.

Rates are likely to continue to rise.  There will be competition at the margin for large balances especially as money market mutual funds are now paying 4.5% or more.  If credit unions take care of their core members, they will take care of the credit union.

The February NCUA Board Meeting

The NCUA Board had three topics:  NCUSIF update, a proposed FOM rule change, and a new rule for reporting certain cyber incidents to NCUA within 72 hours of the event.  The NCUSIF’s status affects every credit union so I will focus on that briefing.

We learned the fund set a new goal of holding at least $4.0 billion in overnights which it is projected to reach by summer.  Currently that treasury account pays 4.6%.  With several more Fed increases on the way the earnings on this $4.0 billion amount alone (20% of total investments) would potentially cover almost all of the fund’s 2023 operating expenses.

Hopefully this change presages a different  approach to  managing NCUSIF.  Managing  investments using weighted average maturity (WAM, currently 3.25 years) to meet all revenue needs, versus a static ladder approach, means results are not dependent on the vagaries of the market.

At the moment the NCUSIF portfolio shows a decline from book value of $1.7 billion.  This will reduce future earnings versus current market rates until the fund’s investments mature, a process that could take over three years at current rate levels.

Other information that came out in the board’s dialogue with staff:

  • Nine of the past thirteen liquidations are due to fraud. Fraud is a factor in about 75% of failures;
  • More corporate AME recoveries are on the way. Credit unions have been individually notified. The total will be near $220 million;
  • If the NOL 1% deposit true up were aligned with the insured deposit total, yearend NOL would be about .003 of lower at 1.297% versus the reported 1.3%. Share declines in the second half of the year will result in net refunds of the 1% deposits of $63 million from the total held as of June;
  • Staff will present an analysis next month of how to better align the NOL ratio with actual events;
  • The E&I director presented multiple reasons for NCUSIF’s not relying on borrowings during a crisis, but instead keeping its funds liquid;
  • The E&I director also commented that the increase in CAMELS codes 3, 4, 5 was only partly due to liquidity; rather the downgrades reflected credit and broader risk management shortfalls;
  • NCUSIF’s 2022 $208 million in operating expenses were $18 million below authorized amounts;
  • The funds allowance account ($185 million) equals 1.1 basis points of insured shares. The actual insured loss for the past five years has been less the .4 of a basis point.

Both the Callahans Trend Watch industry report and NCUA’s  insured fund update with the latest CAMELS distributions suggest a very stable, sound and well performing cooperative system.

A Disappointing NCUA Response

Against this positive news, is a February 15  release from the Dakota Credit Union Association.   It stated NCUA had denied claims of 28 North Dakota credit unions for their $13.8 million of US Central recoveries from their corporate’s  PIC and MCA capital accounts.

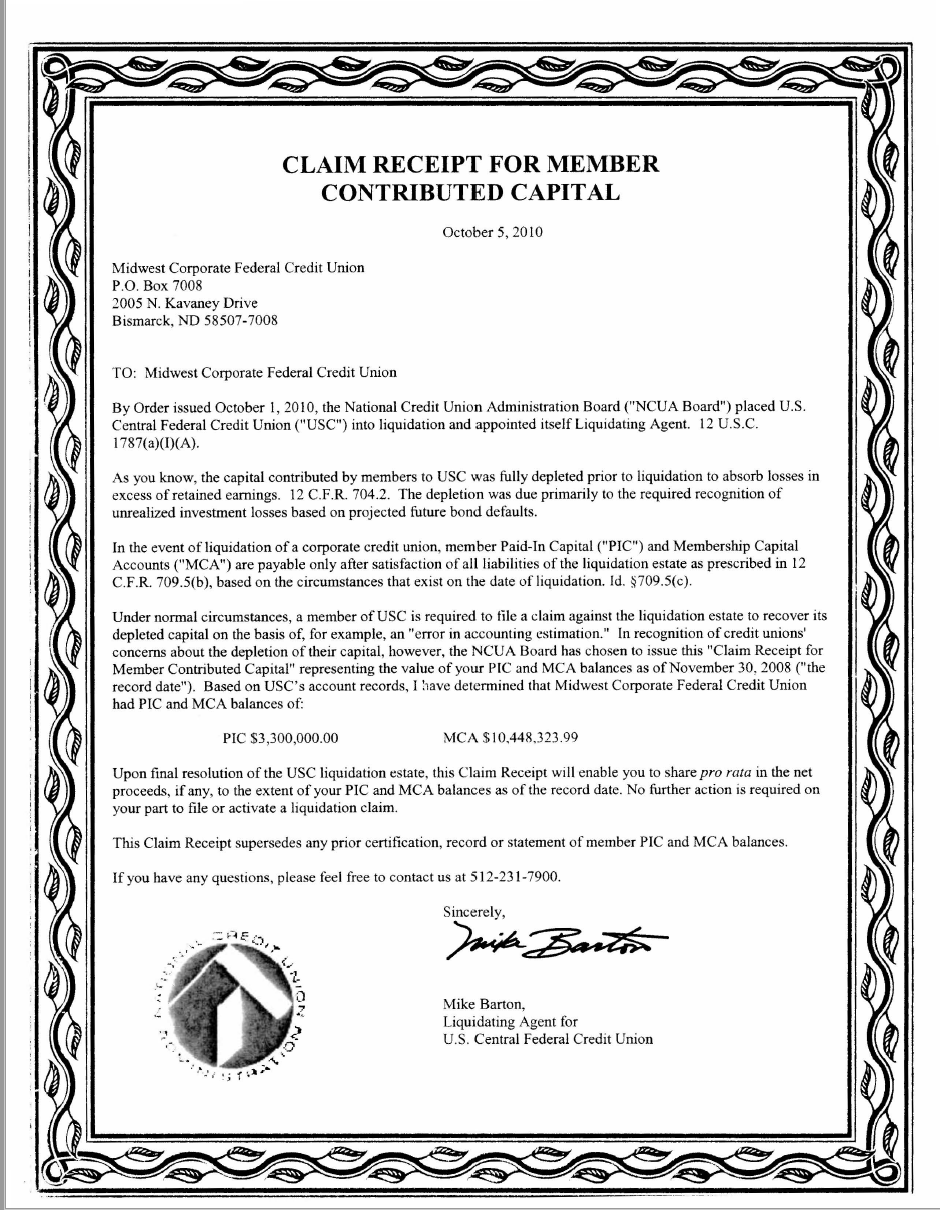
These credit unions were the owners of Midwest  Corporate which placed these member funds in the US Central’s equity accounts, a legal requirement for membership.   The NCUA claimed that the owners of Midwest Corporate had no rightful claim, even though a claim certificate for these assets was provided by NCUA.

Nothing in this certificate says that the claim is no longer valid if a corporate voluntarily liquidates.

Under the corporate stabilization program corporate owners were forced to choose between recapitalizing after writing off millions in capital losses in 2009, merge with another corporate, or voluntarily liquidate.

Both the Iowa  and Dakota corporates chose to voluntarily liquidate versus facing the prospect of further corporate capital calls.

The NCUA oversaw the liquidation of both Corporates in 2011. The NCUA’s liquidating agent knew  that claim certificates were issued, that there was no wording that voluntary liquidation would negate future recoveries for the corporates’ owners and that NCUA’s legal obligation is to return recoveries to the credit union’s owners, whether in voluntary or involuntary liquidation.

The claim receipt specifically states: “No further action is required on your part to file or activate a liquidation claim.”  Yet that is just the opposite of what NCUA is now saying the credit unions must do.

For example NCUA continues to pay recoveries to the owners of the four corporates who were conserved and involuntarily liquidated by the agency.

According to Dakota League President Olson, NCUA has failed even to inform the league  in what accounts these funds are now held.  Are they being distributed to all other US Central owners? To the NCUSIF? Or held in escrow?

“This is a clear case of obstruction through bureaucratic hurdles and complicated language where the process is the punishment, and does not provide justice,” stated Olson.

These funds  ultimately belong to the member-owners of these credit unions  The NCUSIF is in good shape.  This is not a legal issue.  It is common sense.

NCUA controlled all the options for every corporate through through its stabilization plan. It took total responsibility for returning funds-no further action required. No one will critique returning members’ money.  But failure to do so undermines trust in the Board ‘s judgment, its leadership of staff, and its fiduciary responsibility for credit union member funds.

The NCUA board should do the “right thing” for these credit unions and their members.


Credit Unions & Risk Based Capital (RBC): A Preliminary Analysis

From the June 30, 2022 call reports, NCUA reported:

  • 399 CUs opted into the Complex Credit Union Leverage Ratio (CCULR) framework with an average CCULR of 11.35%, or 26% higher than the 9% floor.
  • 304 CUs reported under the Risk-Based Capital (RBC) framework with an average RBC ratio of 15.39%, or 54% higher than the 10% minimum.

The 500 page, RBC rule and its almost 100 ratio calculations became effective January 1, 2022.  Just two weeks after NCUA board approval.

It was intended to provide greater insight about a credit union’s risk profile and capital adequacy. What can an analysis of the RBC adopters tell us from this initial implementation?

The Macro Totals

The 304 credit unions plus 4 ASI-insured who adopted RBC, manage $822.7 billion in assets.  But the risk weighted assets total only $479 billion.  That 58% ratio  is the NCUA’s discounting of total assets total by assigning relative risk weights.  For example some assets have zero “weight” (cash, treasuries) or negligible emphasis ( GSE’s 20%).

Compared to the traditional well-capitalized 7% of assets standard, this group holds $20.5 billion in excess capital above this ratio.

Using the minimum RBC ratio of 10%, this same group holds $26 billion in excess of the minimum.  As shown above, their average RBC is 15.4%.

The bottom line is that this group of credit unions is well capitalized whether using the 7% traditional level or the new RBC 10%.

Other Initial Findings

One intriguing fact is that 149 of these credit unions, or almost half, have traditional net worth exceeding 9%.  That  suggests most could opt out of the RBC calculations as they exceed the CCULR 9% compliance minimum.

For example, one credit union with assets between five and ten billion dollars, reports standard net worth of 12.5% and an RBC ratio of 48.3%.   Why did they report RBC versus CCULR?

One way CEO’s can use RBC is to show that even with a low traditional net worth  they are still more than well-capitalized.  A CEO holding 7.5% net worth may want to allocate future earnings for greater member value and avoid the 2% tax on net income  to maintain the 9% CCULR minimum.  Showing a high RBC to your board and members is a powerful defense of the lower traditional net worth measure.

A Look at Ratio Methodologies

However as shown by the banking example below, RBC captures very few risk factors. Its focus is solely on potential credit and/or principal losses on loans and investments.

One example: 250 of these 308 credit unions reported unrealized declines in the market value of investments that exceeded 25% of net worth.   Four credit unions reported a decline greater than 50% of capital.  This was before the five additional Federal Reserve’s  rate increases through the end of the year.  This situation is not recognized in RBC.

To compare peers and their capital performance is very confusing.  RBC credit unions can choose four different ways of calculating the ratio’s denominator.   Seventy two credit unions opted for a ratio  that did not use June quarter ending assets.  They chose one of three other options that  results in a lower total asset amount, and therefore a higher RBC outcome.

RBC ratio comparisons are further complicated when 152 of the RBC credit unions had a combined risk weighting of less than 60% of total assets.  In one case the risk weighted assets were just 24% of the total balance sheet.

Another difficulty in  comparisons is that there are other options for capital creation than retained earnings.  Seventy-six credit unions report that less than 95% of their “capital” came from their own earnings.  Twenty-four reported subordinated debt as capital and the majority of the remaining group were from equity acquired in a merger.

As a result RBC net worth ratios  reflect different capital strategies.  There is a difference in operating capabilities between institutions who rely solely on retained earnings and those who purchase capital.

Performance Outliers

The RBC spread sheet easily identifies those near the 7% minimum requirement-one is below 7% and 12 between 7 and 7.5%.

Using the 10% minimum RBC net worth, eight credit unions fall below this ratio and 15 have 10.5% or lower, and are close to the minimum.

These screens would be one way of assigning exam priorities.

Initial Observations About RBC

From both the macro numbers and the micro analysis, RBC does very little to inform about safety and soundness.

  1. The calculation is a backward looking indicator of soundness. It is at a point in time and includes no dynamic ratios.
  2. Comparisons of peer capital adequacy using ratio analysis is virtually meaningless because of the range of calculations possible and distribution of risk weighted assets.
  3. No current, critical performance indicators are included. No delinquency, no expense ratios, no liquidity indicators, no IRR or ALM measures, and certainly no growth factors of any kind.

Ironically, is it possible that a very high RBC ratio indicates very poor value creation for members? The very opposite outcome for a credit union to sustain success?   Are the 33 credit unions with RBCs in the 20%, 30% and 40% ranges really serving members as their below average  loan/share ratios leads to higher reported RBC?

A Preliminary Look

The above analysis is as of June 30, 2022.  I will revisit the RBC reporting credit unions at December 2022  to see if the numbers have significantly changed.  For example, how many of  the 148 above 9% net worth opt for CCULR?  Credit unions will then have a full year’s and four quarters experience exploring the pros and cons of using RBC.

At this preliminary analysis, RBC looks like an exercise for credit unions to select their most favorable capital presentation. It may even create perverse regulatory incentives  that undercut initiatives for enhanced member value.

A Case Study of RBC and Bank Reporting

The following is an excerpt of RBC analysis of a bank serving the crypto industry and its reported capital adequacy.  This was written by Todd Baker, 1stSenior Fellow, Richman Center at Columbia University. (#capital #regulation)

Silvergate Bank has officially reported, and there is a big lesson there for regulators about the failure of risk-based capital standards to adequately address the risks of #banks serving the #cryptotrading gambling emulation of finance.

The wisdom of hard equity leverage capital requirements for banks is clearly demonstrated. They lost a billion dollars and their risk-based capital ratios increased! . .

Again, kudos to whomever managed the process of securities sales, reclassifications, borrowings, etc. at Silvergate. He/she did an amazing job bringing the plane onto the landing strip with one engine in flames and half the tail falling off while keeping the Tier 1 leverage ratio over the 5% “minimum” (which is actually way below the minimum in practice). . .But they still have the need to raise new capital, and fast, because their Tier 1 leverage ratio is way, way too low for the inherent risk from the business, as everyone now knows.

Despite losing a billion dollars (likely more than the company made cumulatively in it’s entire history) in the quarter, driving its holdco ratio of common equity to total assets down to 3.61%, from 8.84% at the end of 2021, and immolating half of the bank’s Tier 1 leverage capital, the bank’s risk-based capital ratios are actually higher (!) than they were at the end of the prior year.


Why? Most of Silvergate’s assets were and are still government securities that are treated as riskless (0% risk weighting) or GSE securites that carry a 20% risk-weighting. Riskless, that is, until you have to sell them in a rising rate environment…

Compare these two disclosures, from year-end 2022 and 2021:

“At December 31, 2022, the Bank had a tier 1 leverage ratio of 5.12%, common equity tier 1 capital ratio of 53.89%, tier 1 risk-based capital ratio of 53.89% and total risk-based capital ratio of 54.07%. These capital ratios each exceeded the “well capitalized” standards defined by federal banking regulations of 5.00% for tier 1 leverage ratio, 6.5% for common equity tier 1 capital ratio, 8.00% for tier 1 risk-based capital ratio and 10.00% for total risk-based capital ratio.” Versus,

“At December 31, 2021, the Bank had a tier 1 leverage ratio of 10.49%, common equity tier 1 capital ratio of 52.49%, tier 1 risk-based capital ratio of 52.49% and total risk-based capital ratio of 52.75%.”


Digital and Branching Options

As credit unions expand their market footprint, branches remain an important investment for growth.

Recently Credit Union Times reported on this effort by five credit unions across the country. Expanding their existing 75 branch network was Suncoast Schools, Tampa FL which is opening  three new branches in Orlando.  Truliant, Winston Salem, NC is investing in a South Carolina expansion involving five new offices in three years.

The Times story also described new branch openings by Blue FCU, Cheyenne, WY; Utah Community in Provo; and Brooklyn Cooperative FCU in New York.

In Person Matters

If digital transactions and virtual platforms are the future of financial services, why are these and other credit unions continuing to invest in real estate and a physical presence?

Part of the answer is that opening new markets is very difficult to do with a virtual only strategy.  Platform solutions bring individual responses to promotions.  However “seeing is believing” if credit unions want to have a continuing community presence and impact.

However another factor may be the reality that Stores Aren’t Dead, according to a February 10 article in Axios.

According to data from Coresight, “physical store openings exceeded closings on an annual basis in 2022 for the first time since 2016.”   Retailers are on a pace to open more stores at an even faster pace in 2023.

Why?   “While e-commerce platforms helped retailers manage the pandemic — but both retailers and consumers realized the limitations of doing business entirely online.”

Bargain hunters like to shop in person.  The top six retailers opening stores in 2022 were dollar chains and discounters, including Dollar General, Family Dollar, Dollar Tree, Five Below, TJX Cos. and Aldi, in that order.

Those customers would seem an attractive demographic for credit union services as well.

Digital transactions for existing members are an important option for supporting these members efficiently.  But a physical presence is what communicates commitment to a community.  And being there for an ongoing relationship.

Epitaph for THE Cooperative Book of Discovery

This post is a eulogy.  For 36 years credit unions were provided a comprehensive report on their collective progress.   That publishing effort grew in scope, analysis and detail while keeping the same title: The Credit Union Directory.  It is no more.

The Credit Union System’s Essential Resource


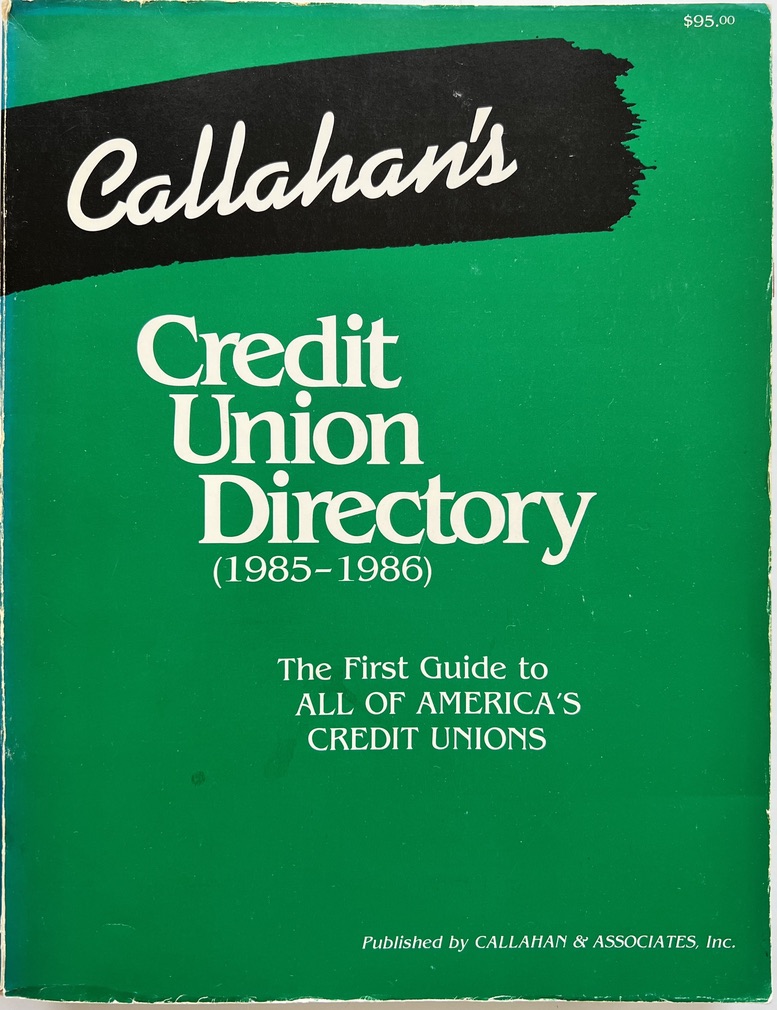
In 1986 Callahan’s introduced the first complete Directory of all active credit unions for the industry’s and general public’s use.   It was a complete census by state of every credit union, a task never accomplished in the eight decades since the first charter.

One reason for this gap was there was no centralized source for information.  NCUA’s call report included only federally insured data. There were approximately 1,800 cooperatively insured credit unions in over 20 states that offered a choice of share insurance.

Prior directories were periodically attempted.  One listed the  4,000 largest credit unions by assets.  Some state leagues published listings, but they were not for public use.

A Calling Card

The Directory was Ed Callahan’s  idea.  At great expense, Callahans had established a database of all NCUA data, augmented with cooperatively insured information. We believed the industry and public would beat a path to our door for the latest, most complete data on credit unions.

The company had an outstanding invoice for over $100,000 with a local service bureau that managed the information.  No one came knocking.  Ed decided we needed a “calling card” to let people know about our analytic capability.  Hence the first Directory, with 1985 data listing every credit union, was released at the  February 1986  CUNA governmental affairs conference.

The initial product was a literal directory organized by state listings in credit union alphabetical order.  The single line of information with the credit union was the CEO’s name, contact information and summary financial data:  total assets, loans, members and capital.
As the Directory became an annual effort, the content expanded.  Advertising was added to support production costs.  The concept of  a one stop information resource  became widely valued.  At least three other competitors entered the market:  NCUA printed and gave away a  state listing of its insured; Thompson’s added a credit union volume to their bank and S&L publications; and CUNA attempted its own version.

All subsequently dropped their “directory”  efforts.  For Callahan’s, this calling card expanded with more analysis and industry listings.  It demonstrated the firm’s software capabilities that eventually led to the development of Peer to Peer as the premier industry analysis product.

Annual  Publications:  The 2006 Example

The listings remained central, but the annual analysis expanded in multiple ways.

New reference material was included to give added value and market reach.  For example, the top 100 Canadian credit unions were listed in the belief this might open up a northern market.  It didn’t.  World Council information was presented showing the US totals in a worldwide context.

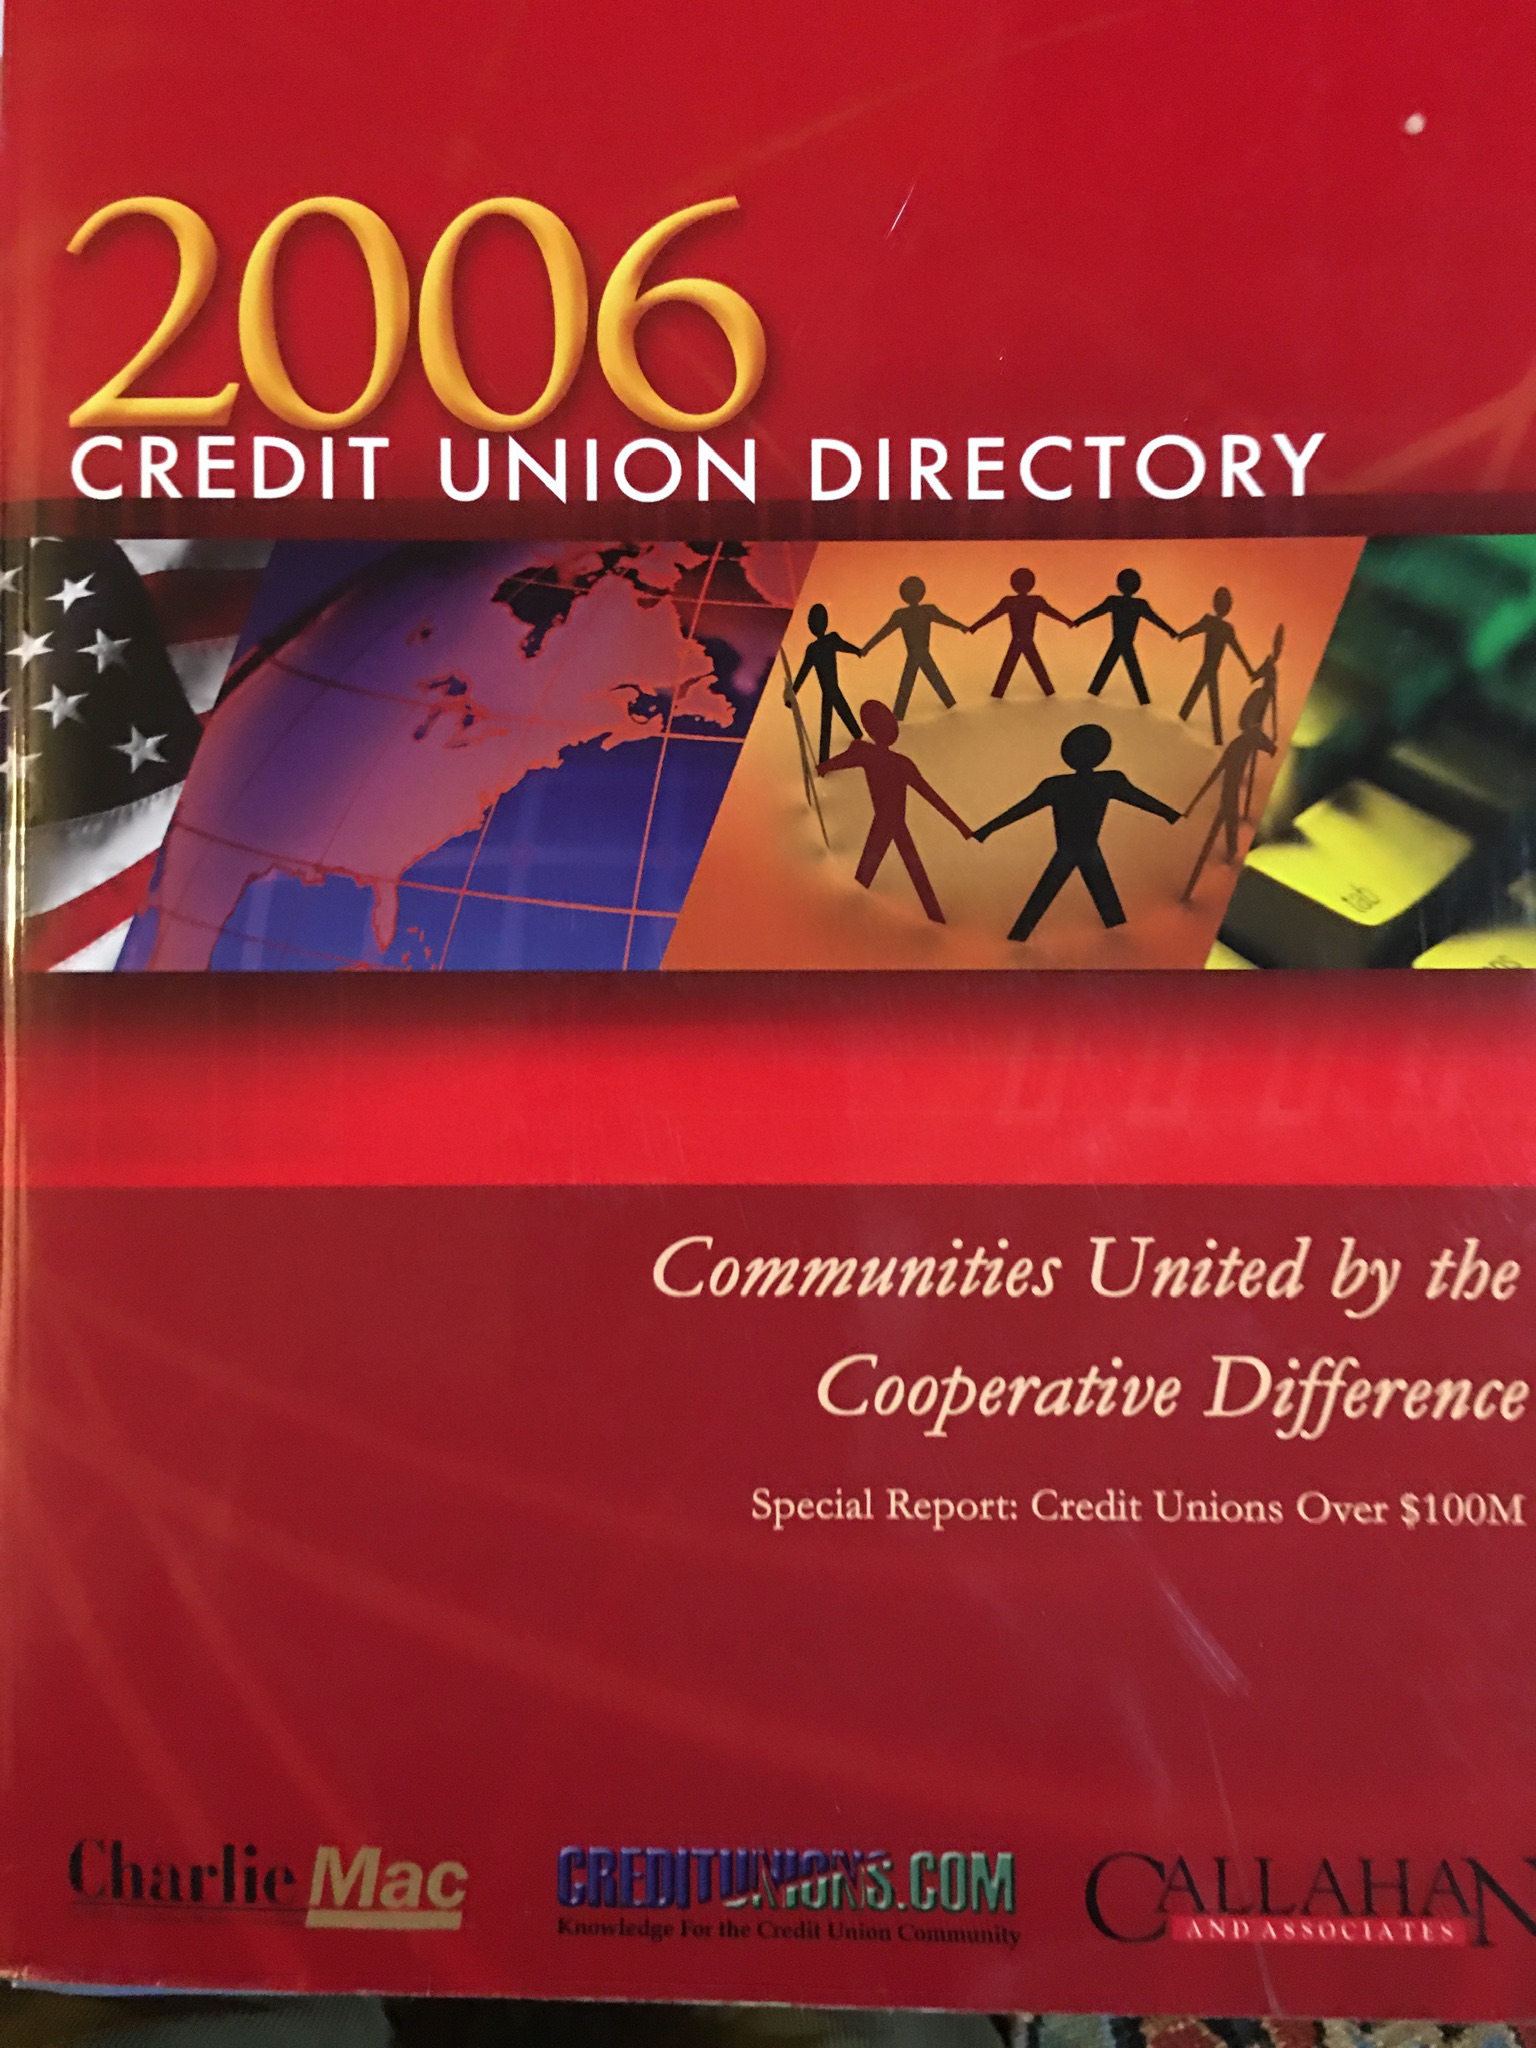
An example of this ever expanding effort is the 2006 edition which totals 646 pages in four tabbed sections.

Each year, the Directory’s cover was redesigned. A theme summarizing the movement’s progress was introduced .  In 2006, the message was Communities United by the Cooperative Difference.
The first tab, State of the Industry, presented the industry’s consolidated balance sheet and income statement, key trends and auto  loan share by state; 30 “best in class” leader tables;  an analysis of the corporate network;  a listing of CUSO’s, credit union auditors, leading technology providers and a list of mergers.  Contact information for all state and federal regulators, leagues and trade associations and Canada’s largest 100 credit unions were provided in just the first 125 pages.

Tab two was  the traditional listings provided by state.  Each state was headed by a five year performance summary and a top 50 by assets table preceding the alphabetical list of all the credit unions.  Seven pages were devoted to comparing state by state performance on key ratios.

The third tab was a cross reference listing where a user could look up credit unions alphabetically by name,  by city, or by the manager’s last name.  For example, seven Carlsons and 65 Johnsons.  Buffalo, NY, reported 42 credit unions with home offices in the city; Carmel, IN, had just two.

If one wanted a quick summary of credit unions by employment, the reader could look up credit unions that had Post Office or Postal, IBM, State Farm as a first name.  Or, if looking for parish-based credit unions, one would find 185 credit unions whose name began with St. (Agnes, et al ).

The final section was a buyer’s guide which showed 115 vendors serving the credit union community.   And helped to underwrite the Directory’s printing costs.  The sponsor for 2006 was Charlie MAC.  For those not familiar with US Central, this was a secondary market initiative for credit unions to compete with the government sponsored GSE’s.

The Incalculable Resource

Each edition attempted to list the major system components and the businesses serving credit unions.  To address concerns about timeliness of the data (publication occurred about 4-5 months after the financial information), Callahans in 2006 created a “Directory Online” with 24/7 access.  This digital version was updated with the latest financial as well as contact changes.

By publishing annually, the industry had a comprehensive set of performance benchmarks in one volume.   Who had moved in or out of the top 200?  How many credit unions have home offices in DC?  Or,  what states have the fastest growing coop system?  While the information was at a point in time, it was a starting place for limitless stories and analysis, then or in years later.

Leaving the Scene

Callahans last annual printed Directory was volume 36, published in 2021 using December 2020 data.  This edition had 221 pages including a 29-page buyer’s guide.

There was industry analysis with ten-year trends, leader tables, and peer group comparisons.  There was still a state-of-the-state section in which all the individual credit unions were listed.  Contact information was also provided for CUSO’s, Corporates, regulators, and trade associations.

There was no introductory analysis or theme, undoubtedly hindered by the Covid lockdown and recovery during the production cycle.

In 2022, there was no printed edition.  The industry trends, top 50 or 100 listings, the corporate network and state summaries are available online.  If printed, the  information would  total 132 pages.  There is no advertising or buyer’s guide.

Does It matter that there is no longer a printed Directory?

There are certainly virtual substitutes for some of the data listings and contact information.  One can search on NCUA’s site for peer information and trends.  Pulling other categories of information (CUSO’s, trade associations) would require someone with a knowledge of relevant  resources.  If interested in a year’s key industry events such as large mergers, charter conversions, bank purchases, or even newer data sets such as subordinated debt or goodwill, one would have to find a credit union database resource such as Peer to Peer.

The Directory’s function expanded assembling  performance and individual credit union data to serve as a starting point for insight and analysis.  At a macro level, the Directory was the only source for  ten-year financial trends and a two-year balance sheet and income statement that includes all credit unions, not just NCUSIF insured.

But the Directory was more than a useful compilation for quick reference.  It presented the industry’s multiple connections and comprehensive participants.  Each volume was a census of all key movement participants (by name and organization) and  an almanac of the  year’s trends.

Each edition presented the collective industry’s performance, information missing from all other yearend reports.  For example, NCUA’s Annual Report records its activities and financial audits, not credit unions’ role in the economy.  Trade groups report  their advocacy, education and  information services.  Individual credit unions promote their own success and accomplishments.

What is lost is the sense of cooperative identity, a shared destiny and a system with special purpose that serves over 100 million member-owners.   If one were to understand the history of the credit union system, especially the post deregulation era, the Directory would be the major resource.

This bridge connecting the past to the present no longer exists.  Each future writer or researcher will have to find their own way to the history.

The Directory memorialized multiple national, state and local  milestones for a movement whose future should be more consequential than its past.

Without this collective benchmarking, can there be a shared purpose? If one fails to celebrate birthdays, anniversaries or other key events, life goes on.  So will credit unions but with less of a sense of who they are and where they have come from.

A movement without a collective memory can slowly disintegrate into individual contemporary stories.   The shared destiny is lost as firms follow their own independent journey. A Community United by the Cooperative Difference no longer has a record of who they are.


Searching For Credit Union History

Three weeks ago I received a unique document.  It was John Tippet’s 2001 speech to Navy FCU’s board at their annual planning conference. John Tippets was then CEO of American Airlines FCU, now retired.

The presentation was typed in full along with the slides used.   John presented his credit union’s strategy and how he believed this implemented credit union’s unique design.

Ten years later (2011) Navy’s planning COO requested a copy. Now twelve years further on, I will share some of his thoughts. I believe they are an important example of a leader’s vision and provide important perspective today.

History Matters

The American historian David McCulloch wrote over a dozen books and countless speeches on transformative events (1776) and the people who played important roles.  His accounts are lively and compelling.  He drew upon stories from his subject’s diaries, letters, speeches as well as second hand press accounts recreating these past scenes.

As an author, he believed history was larger than life.   A country’s stories, he believed,  are its most critical  resource.  When well presented, often from original records, they enlarge the spirit and shape our understanding of who we are.  And what we aspire to become.

If one reads the Congressional Record transcript of Ed Callahan’s last testimony as NCUA chairman on April 24, 1985, there can be no question of his impact.  His eloquence, factual knowledge and even humor with the committee shows their respect of his leadership of NCUA during this very vital time for financial services.  The words recreate the event and provide, still today, insight into a leader’s talent.

Or read the July 16, 1982 hearing transcript of NCUA General Counsel Bucky Sebastian’s testimony before Chairman Rosenthal’s House Committee on Government Operations.  The Committee was investigating the failure of Penn Square Bank and its impact on credit unions. It had occurred just two weeks earlier. The back and forth between Sebastian and the Committee chair jumps off the page.  It shows clearly two very different understandings of the event and the role of government.   Bucky’s powerful argumentative style is on full display!

The Absence of Credit Union Records and Original Documents

The years 1981-1985 were pivotal in credit union evolution.  Their response to the economic crisis and the deregulation of America’s financial system was critically important for their members’ future.

These major events unfolded just as NCUA was still organizing itself as an independent agency with a three-person board appointed by the president.   Prior to this federal credit union oversight had been by a single Administrator housed within HEW.

In response to these changes, a separate credit union press of weekly or monthly newsletters was begun. These included CUIS (credit union information service), NCUA Watch, Report on Credit Unions and smaller commentaries. The trades wrote current stories in their weekly updates mailed to members.

These critical original documents from this period are hard to find.   I have contacted CUNA Mutual, CUNA, the Credit Union Museum and even the Library of Congress.  No copies of any of these written sources seem to be available.

Even more vital would be recorded speeches.  In this era all major credit union conferences would make cassette recordings of the keynote speakers and sell them to attendees to take home to boards and staff unable to attend.

A major event was CUNA’s Governmental Affairs Conference held every February at the Hilton Hotel. The NCUA chair’s speech would be a highlight.  I found a copy of Callahan’s 1983 and 1984 presentations.  But the most pivotal ones from 1982 and 1985 are missing.

State leagues and other conference organizers routinely recorded presentations by NCUA personnel as well.  Finding copies of these tapes is very difficult. The firms organizing the events have long ago moved on.  These live recordings are often seen as yesterday’s news when found in office records.

In this pre-internet period, NCUA communicated with its staff in six regional offices and the credit union community with a new media, VCR.   NCUA’s Video Network issued 21 productions over three years.  No copies can be found for many episodes. Neither NCUA nor the National Archives have the tapes of these critical updates.

Telling the Credit Union Story

Contemporary leaders are focused on creating their story rather than learning about the past.  Many of the participants from this critical 1981-1985 era have retired years ago.  Memories fade.  When their boxes of credit union experiences and keepsakes are opened by children or grandchildren, they rarely have any personal meaning for the family.  So out they go.

The founders of these earlier newsletters and conferences leave no legacy of their vital role of credit union events now forgotten.

But somewhere in a closet, garage, or basement storage area I believe some of these original records (newsletters, recordings, VCR’s) exist kept by those as memories of an important part of their lives—but even more consequential, I believe, as original sources of credit union history.

Can reader’s provide suggestions where some of this trove of credit union history exists?

I will be glad to digitize any records that a person wishes to keep.  The years of 1981-1985 are a turning point.

Parts of John Tippet’s 2001 statements on his credit union’s strategy will spark controversy.  It did then and it will today.   Some of the same challenges remain.  For the credit union story is always being updated.

Can you help me fill in some of the missing parts from an earlier era?  It will be entertaining, illuminating and educational.   Please let me know what you find or where I might look.


Are Members Losing the Cooperative “Savings” Game?

While the 2022 calendar has turned, we do not yet know the full results for the credit union system.  And how member returns may have ended up.

The number one economic topic in 2022 was inflation.  In response the Fed raised short term rates from 0-.25& to 4.25-4.50% in seven steps.   The rest of the yield curve rose although not  always in a parallel fashion. In some time periods,  the yield curve has inverted meaning short term returns exceed longer maturities.

Credit unions fund on the short end of the curve. Liquidity was, and still is, a top credit union priority.   At September 30, annual loan growth was 19.4% versus share growth of  just  6.5%.  Unrealized investment losses had grown to $40 billion, Total investments had fallen by over $100 billion.  FHLB borrowings were double the amount versus a year earlier.

So how did credit union member owners fare overall in this rising rate environment?  For the entire industry the year-to-date results through September show loan yields have risen, cost of funds has fallen by 2 basis points, and the net interest margin has increased by almost 20 basis points.  Rising loan demand was the primary reason for this margin increase.

The Top 100 Report a $51 Million  Decline in Dividends Paid

A commonly accepted truism in credit unions is that the larger the credit union, the greater the possible member value.

In 2022 Vanguard’s federal money market fund had a total return 1.55% rising from .01% in Q 1 to a 3.99% distribution at December 31, 2022.   These savers returns rose as did market rates.

For members of the top 100 credit unions there was a very different outcome.  In 63 of the largest credit unions the total dividend dollars fell by an average of 12%.  The total decline was $241.7 million versus the amount paid in the first three quarters of 2021.  For some the fall in rate was precipitous.  One credit union reduced total dividends by 46.3%; three credit unions reduced their dividends by over 30% versus the year earlier.

In contrast, thirty seven of the top 100 reported an average 21.7% increase in paid dividends.  One caveat: approximately seven of these increases were due to mergers or bank purchases which increased total shares by this externally acquired growth.  Their dividend payments may not be an apples-to-apples comparison.   However, ten credit unions in this group, all with only organic growth, reported over 20% increases in dividend payments.

When adding up the total dividends paid by the 100 largest credit unions through September, the combined result is a $51.2 million decline in member income on their savings.

The proviso:   The game is still has one quarter to go.  Some credit unions pay significant yearend bonus dividends and /or interest rebates.  These will need to be added in the final quarter.  With full year data we can also estimate the average dividend rates to compare with  alternatives during the year.

The Existential Question for Credit Unions

In the first three quarters of 2022, members are paying more for loans, credit unions are earning higher investment returns, salaries and benefits continue to grow, and total capital has  increased. However, many members are seeing a reduction in the dollars paid on their savings.

I will revisit these top 100 to see the full game’s results at December 31.  Did member-owners win or lose in this rising rate environment? Which credit unions navigated this rate transition most effectively for their savers? How did they do it?

Will members continue to “subsidize” the largest coops, many with increasingly public visibility, by accepting falling returns on savings? One money market fund today pays 4.25% (seven day SEC yield) with an expense ratio of only .10 basis points.  Will large shareholders start to move funds from their lower paying credit union money market products?

CEO’s frequently assert that member loyalty lasts for only 25 basis points.  The US economy has had historically low rates since 2009.  Lower inflation and the Fed’s “quantitative easing” have led to an unusual financial period where the cost of money was at or near zero.  Can credit unions avoid the “bubbles” created by this historically rare very low-rate environment?

Will CEO’s adjust their business models so that member savers can be winners in 2023?   So far the data show there is a significant gap  for coop owners to receive the results they will increasingly expect versus other options.

In 2023 will the largest 100 turn into leaders, or the majority continue as laggards in savings returns?

If many of these largest firms cannot remain competitive for savers, is the cooperative financial model at risk?

Or do these falling returns, just reflect management slowness in responding to the changed interest rate situation?


When Goodwill Becomes Ill-will (part II of II)

In this second blog I look at examples of goodwill. What are  some of the financial and regulatory implications of this ever increasing intangible asset?

The following are the  34 credit unions (out of 277) with the largest amounts  of good will at September 30, 2022.

The goodwill net worth ratio, column three, compares the size of this intangible asset to net worth. This ratio ranges from a high of 31% for Chartway to a low of .32% for Navy FCU.  There is no regulatory limit on how high this percentage can be.

While I do not know the details of every credit union listed,  most of these goodwill leaders occur  from either whole bank purchases or mergers with other credit unions.  The first two names, GreenState and State Employees (NY) are examples of each activity.

The Regulatory Situation

As discussed in Part I goodwill is an intangible asset representing  future economic benefits arising from assets acquired in a business combination,  traditionally mergers or purchases.

It is not part of equity or retained earnings from a presentation standpoint.

Goodwill lacks physical substance.  It is an accounting estimate based on assumptions used to project potential future value. Unlike mortgage servicing assets which are also an intangible, goodwill can’t be bought or sold.

If credit union A merges with credit union B which has goodwill on its books, credit union A receives no benefit.  Credit union B’s goodwill is devalued to zero. It is not carried over onto credit union A’s books.

As the underlying  benefits  are realized, impairments to goodwill can be recorded.  A credit union can also amortize goodwill over ten years.  In both instances those charges flow through the income statement and reduce  retained earnings.

In either option, all goodwill must be assessed for impairment at least annually.

Goodwill and Net Worth

For credit unions following CCULR:   Goodwill is not part of Net Worth (numerator) for ratio purposes but is included in total assets (denominator) to determine the net worth ratio (NWR).  Goodwill balances must be less than 2% of total assets to opt into CCULR.

For credit unions subject to RBC:  Goodwill is a reduction from the RBC Numerator and also from the Denominator.

Goodwill Uncertainties

In corporate America public companies report over $4 trillion of goodwill on balance sheets, primarily from mergers and acquisitions.

While accountants agree on what goodwill is, how to value that goodwill after it’s passed onto the buyer’s ledger sparks plenty of argument.

There is much uncertainty about forecasting goodwill’s future benefit for a firm – it involves more judgement calls than many accountants are comfortable with. And while goodwill is listed as an asset on the balance sheet, is it really worth its stated value? What if it was a bad buy at an inflated price in the first place?

In June 2022 FASB announced it had given up on a four-year effort to simplify goodwill accounting determinations.  The current annual impairment test remains the requirement versus a  straight line annual amortization approach.

The Credit Union Goodwill Challenges

When creating goodwill, credit unions have all of the same accounting challenges as public companies but none of the checks and balances .

The ongoing difficulty is assessing post acquisition performance to see if  it is meeting the values projected when the goodwill was first established.

In cooperatives this  is made much more difficult because in both mergers and acquisitions, there is virtually no public disclosure of an acquisition’s costs  let alone  future projections.

For purchases, credit unions rarely report the total price paid(except when a bank is publicly traded)  the broker and transaction fees,  the future impact on ROI or ROE and the longer term performance goals to be achieved.   For mergers, no details of a combined operational plan are provided just the asserted advantage of bigger size and more capital.

Most large mergers and whole bank purchases take years for operational and business integration to be fully realized.   These transactions generally end relationships  and market presence created from years of continuous service.  That history  and local advantage is now gone.

In some large credit union mergers a whole new corporate brand and identity are part of the combined entity’s future business plan.   Shedding past connections to create a whole new market persona would seem to undermine a valuable legacy.

No Accountability

Credit union mergers and bank purchases are not market based transactions.  They are private deals negotiated for mutual advantage by CEO’s and then announced to members. Because there is no transparency or numbers provided,  little future monitoring possible.

Both transactions create  goodwill but the credit union is playing with members’ house money.   If the deal works out after three or four years, whatever benefits of expansion have been achieved are trumpeted as the result.   If  the bank purchase was overpaid, there is no stock price or performance metric that would highlight this misjudgment.

The bank owners are paid a cash premium for their shares from the members’ savings. They have left  with cash in hand. If a transaction is poorly priced or managed, then the goodwill is written down from  members’ existing capital.

The goodwill concept allows managers to pay premiums for purchases absent any performance goals.   In a merger, goodwill in excess of book net worth just enhances the  ongoing credit union’s capital but members receive nil for this value.

Transforming Goodwill Into Ill-will

When leaders operate in a closed environment, unconstrained by member or board governance, personal ambition can run amok.

With no meaningful credit union disclosures to members or the public in either mergers or bank purchases, managers are free to wheel and deal.   A number of CEO’s have been very public about their “nonorganic” growth plans.   Goodwill is the intangible asset created to make things appear OK regardless of price or terms.

The animal spirits of capitalism are quickly embraced versus the cooperative focus on members’ well being.  But unlike truly competitive markets, there is no stock price or market assessments monitoring  performance.

When goodwill accounts begin to approach 10% or higher of net worth, the credit union has disguised its ability to produce operating earnings.   To keep the game going, more purchases and goodwill are pursued, always justified by scale and more diversification.

At some point the economy turns, the acquired assets become overvalued and members are given the short stick as dividends are reduced to keep up the ROA goals. In several of the credit unions  listed dividend payments were reduced in 2022 versus 2021 to sustain ROA even though short term rates have risen by over 3%.

Staff layoffs are another indication of overcommitments.  Examiners or accountants  will start to question the goodwill asset’s value.

The goodwill that underwrites cooperatives can quickly turn to ill-will.  When members realize their collective legacy in mergers was transferred to solely benefit senior managers, the loss of confidence will undermine both the new entity and the cooperative system’s reputation for fair dealing.

When the out of state or out of market bank purchase shows no growth, the tactic of buying market share begins to fail.

The facade of goodwill falls away for both the credit union and the members.   Once gone, it is lost forever.  That is what intangible means.


Two Meanings of Goodwill (part I of II)

Tis the season for evoking goodwill.   Company/organizational holiday parties, the daily mail full of greeting cards,  Giving Tuesday, community food drives and dozens of other personal and firm initiatives make Advent a time of joy.

Wonderful and colorful decorations enhance this sense of a special time of year. Sporting events promote opportunities to help others. Even if there is constant hurry up, it is a toward good ends.

Concerts and carols bring back familiar lifelong memories.  There is even a heavenly musical declaration of good will in music.

This most dramatic announcement is in the Messiah’s fourth chorus, Glory to God.  As described in Luke 2 v.14, the heavenly hosts sing to shepherds of Jesus’ birth:  Glory to God . . . and peace on earth. This opening is followed by repeated proclamations  of “Goodwill towards men.” 

Angels celebrating a new era in words repeated still today.

More Than Christmas

 Goodwill is not limited to this holiday season.  In everyday usage, goodwill is the feeling of trust, loyalty and support that emerge from a relationship or event. It is the bond greater than any underlying transaction.  It is much more than a feeling of satisfaction.

Rex Johnson, the credit union lending guru, described this as the art of converting members to fans, not just spectators.

For cooperatives, goodwill is an essential component of their market advantage.  It is rooted in members’ belief that the credit union acts in their best interest.  It is embedded in cooperative design. Current generations expect the fruits of their loyalty will be passed to future ones.

When active, goodwill underwrites member relationships giving credit unions a competitive standing no other firm can match. Although real, it shows up nowhere in a credit unions ordinary financial reports.

Accounting Goodwill

There is also an accounting term, goodwill.  It is an intangible asset.  It arises when a credit union acquires a bank or merges with another credit union. The excess of book value  over fair market value of the net assets gained, creates accounting goodwill.

Credit union accounting goodwill has grown dramatically.  The first reported total as of March 2009 was $160 million.  At September 2022, the total was $2.2 billion recorded in 277 credit unions.  Since that initial March date,  it has grown at an annual rate of 21%.

Goodwill is only 2.2% of these 277 credit union’s net worth.  But in some cases it is much higher: 31% of Chartway’s and 21% of Lake Michigan credit unions’ total capital.

Why an Intangible Asset?

Goodwill is classified as an asset because it provides an ongoing revenue generation benefit that extends beyond one year. It may include  such items as customer relationships, liabilities (shares) acquired at below market rates, corporate expertise,  operating (FOM) authorities, or proprietary technology.

Goodwill is recognized only through an acquisition. Unlike member relationships, it cannot be self-created. It is the excess of the “purchase consideration.”

Negative goodwill arises if the acquired assets are purchased at a discount to their fair market value (FMV) and is referred to as a “bargain purchase.”

A description of goodwill accounting and how it works is at this site.

The Status of Accounting Goodwill in Credit Unions

Since December 2018 the total of accounting good will has doubled to the present $2.2 billion. The reasons are two:  premiums paid on whole bank purchases and mergers with credit unions uncovering significantly understated value.

An example of the premiums on whole bank purchases is GreenState which reported $123 million  (12% of its net worth) as goodwill.  The second highest is State Employees in Albany at $112.5 million (16% of net worth) as a result of its merger with Capital Communications.

Because accounting goodwill is an intangible asset, there are numerous issues about how it is considered in net worth calculations, its amortization, and its role in financial decisions.

Tomorrow I will look at the largest reported individual goodwill totals, NCUA’s view of the asset and how it could change the future of the cooperative system.


The Power of the Credit Union Press

Many challenges confront credit union focused news reporting.  Publishing daily via social media is hard.   Staff is limited.  Original stories take time to develop.   Amplifying press releases is often an easy solution when faced with daily deadlines.

Credit Union Times and CUToday  have developed  important reporting niches however.   If readers  follow these original stories, they can provide insight into events that have consequences for the future of the cooperative system.

Following Court Documents

Peter Strozniak of Credit Union Times  follows  court cases about credit unions.  On October 4, he reported on the embezzlement at the $3.2 Prairie View FCU: Former CEO Pleads Not Guilty to Embezzlement Charges.   Some of the details in his coverage included:

  • The CEO’s scheme lasted from 2010 until August 2020;
  • She embezzled over $211,000 from 34 elderly members accounts;
  • Created fraudulent loans for over $791,000;
  • Formed 58 nominee loans by creating fake share loans in the names of relatives and friends

In eight of this ten-year fraud time frame, the credit union reported annual operating losses on its call reports. The credit union was merged in the first quarter of 2022 due to “its poor financial condition.”

The question that jumps out  is how could NCUA examiners have continually missed this illegal activity for ten years?

Peter did not go there with this story, but the details certainly raise a core question about NCUA’s supervision of the FCU.  It was small, with few employees and only 600 members.  The call reports showed  losses for most years.  What does this case imply about the  efficacy of NCUA’s annual examinations?

CU Today Goes to the Public Record

For most of this year, CU Today has summarized the merger activity posted from NCUA’s web site, Comments on Proposed Mergers.

Their latest reviews showed “CUs seeking to merge in multiple other CUs at once, combo’s in which the merging and acquiring CUs are both losing money, and several examples of credit unions reaching across state lines and even across country for merger partners.”

This reporting which includes the latest data and quotes from the member notices, takes a lot of work. Some examples.

One summary is for AIM Credit Union in Dubuque, IA.  It is merging two Keokuk credit unions.  Members of both merged credit unions were given identical Notice statements.  They will be voting on the same day at the same location, First Christian Church.  The two towns are 150 miles or about three hours apart.  Was a local merger of  the two credit unions considered?

In the merger of two Michigan credit unions, Community Alliance Credit Union ($108 million) with People Driven Credit Union ($355 million), the top three executives can receive a total of $542,000 in severance.

Community reported  midyear capital of 8.39% and  a loss of $73,000. The members were offered nothing of the over $8 million in capital being transferred.  Is this an example of taking the money and running away?

The three-year old Maine Harvest FCU with 56% capital is merging so that “its mission of lending to farms and food producers will be better preserved with a larger credit union that embraces that mission.”   Was this option researched at the start?  Why not create a partnership, versus merger, with a larger credit union if more services are needed?

The $210 million Emory Alliance Credit Union in Decatur GA is merging with Credit Union 1 whose main office is listed as Rantoul, Il.  One wonders why?  Were no local options available?   Did Emory do any due diligence on behalf of their members, especially of Credit Union 1’s recent initiatives before recommending this out of state takeover?

Finally, the $226 million Parsons FCU in Pasadena, CA  is merging with the   $1.1 billion Skyla FCU in Charlotte, NC.   Parsons has almost 11% capital.  Merging with a credit union across the country, especially with very strong instate options, would appear contrary to every common sense notion of member service and value. What is the reason for this  “merger” almost 3,000 miles away.

Presenting the Facts for the Public

CU Today and Credit Union Times are serving a vital public, cooperative service developing this fact-based reporting.

Both media raise important questions about motivations and fiduciary duty of persons responsible for these events.

This original reporting  raises critical questions about the directions of credit unions, the regulator’s oversight  and how members’ best interests appear to be so cavalierly and repeatedly disregarded.

Sooner or later the stories behind these events will come out.   The political and repetitional consequences will impact every credit union even when excesses may be the work of only a few.

A diligent, informed and questioning press is critical in holding those in positions of responsibility to account. CU Today and Credit Union Times are doing the job of the 4th estate.  Are credit union leaders getting the message?


Credit Unions and Liquidity Management

Managing liquidity will be an ongoing priority during the interest rate transformation now being led by the Federal Reserve.

Today  I want to show how credit unions have prepared.

Relying on a Cooperative System

Credit unions managing  74% of assets ($1.57 trillion) use the FHLB system.   To borrow from the banks, credit unions must invest in a bank’s capital with borrowings a multiple of their contribution.

As cooperatives, the banks are owned by their members, pay a dividend on the capital and offer multiple borrowing, hedging and funding options.

These 1,271 credit unions report a total of advised lines of  credit of  $288.1  billion at June 30, 2022.

The credit union funded CLF at June 30 reports total membership 349 regular members plus 10 corporate agents which have funded the CLF capital requirements for their members with less than $250 million in assets.

The total CLF capital contributions represent approximately 26.2% of all credit union shares as of June 30.

In addition the CLF has total borrowing authority of $29.7 billion but has no advised lines of credit with credit unions.  This lending capacity, if fully utilized would equal just 10.3% of the total advised lines credit unions report from the FHLB system.

Two Observations

Credit  unions rely on the cooperatively designed, privately managed FHLB with boards elected by the owners, as their primary source of external liquidity.

The CLF, specifically designed for credit unions, has not evolved to respond to credit union needs.   The CLF managed by NCUA has no credit union representation or programs to encourage credit union involvement.

There have been no loans from the CLF to credit unions since 2010.   At that time the two most significant loans were initiated by NCUA as part of their corporate conservatorships of US Central and WesCorp.  These two borrowings were for $ 5 billion dollars each, guaranteed by the NCUSIF.

In the upcoming period of enhanced liquidity management, credit unions are turning to the organizations they own and can rely on.