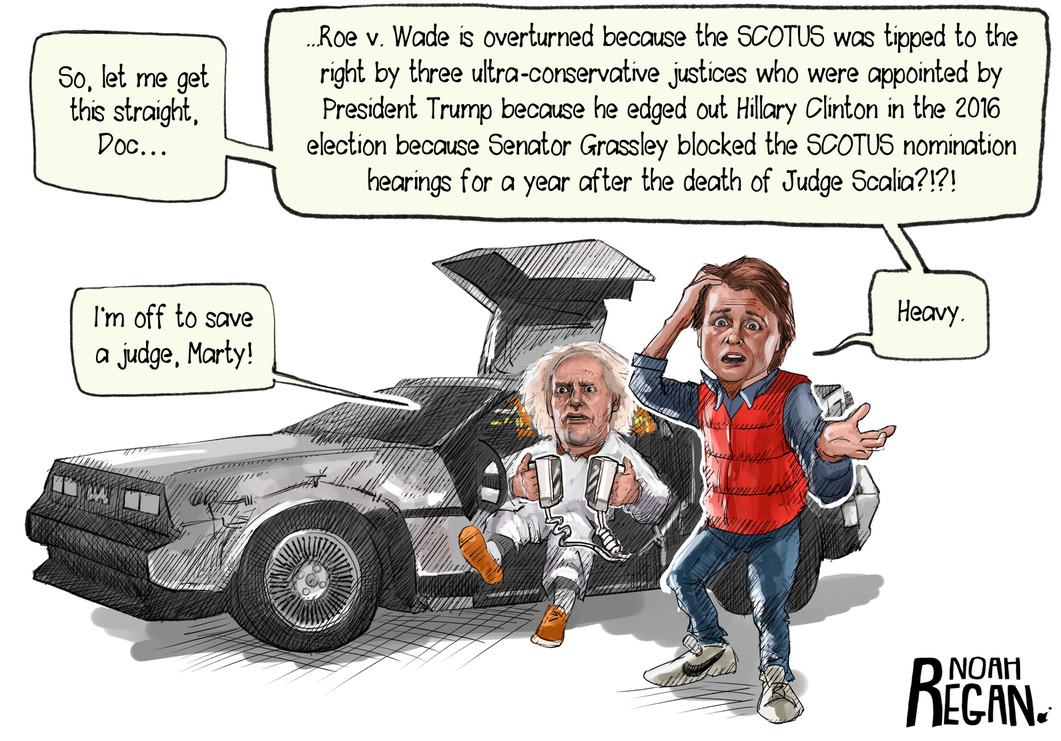
SECU’s Mike Lord: Two Remarkable Accomplishments

The CEO of the $50 billion State Employees’ Credit Union (SECU), Mike Lord retires at the end of this month. His career is noteworthy for two remarkable achievements:

  1. He successfully navigated 30 years of intellectual contrarianism with Jim Blaine, his boss. Jim’s motto is “often wrong, but never in doubt.” His public name-image-likeness (NIL) brand is an animal of the horse family, but typically smaller than a horse with longer ears and a braying call.
  2. Against all odds, he sustained and expanded SECU’s exceptional level of leadership and member well-being as Blaine’s successor in 2016.
    Succeeding a legend and then taking results to a new level whether in business, coaching a sport, politics or any field of public endeavor, is an incredibly rare event.

“Don’t Mess It Up”

The management consultant Peter Drucker stated, “the most common source of mistakes in management decisions is the emphasis on finding the right answer rather than the right question.”

For Lord and SECU that question has always been how to enhance member service. The mission and vision of the credit union are folksy truisms: “Send Us Your Mama” and “Do the Right Thing.”

When Lord became CEO in 2016 his stated goal was just as straight forward: “Don’t mess it up.”

In today’s individualistic culture that celebrates personal achievement, choosing a leader where the mission supersedes personal ego is a tribute both to the organization’s values as well as the leader’s character. Especially so in the second largest credit union in America.

An example of these values is SECU’s compensation practice. The credit union follows the “Mondragon model” to assure balance among all staff. There are no perks, no bonuses, no incentives and all staff receive the same benefits (health, retirement). This means that SECU CEOs are not paid the multi-million salaries prevalent at many smaller, less complex, less successful CUs.

Focus and Consistency

Several decades ago, SECU’s Board decided to “limit” SECU’s FOM to North Carolina. Those members who moved out of NC or lived in foreign countries could remain, but if they wanted loan services they were referred to a local CU. This focus on the core members who “brung us to the dance,” makes SECU a formidable force against major national banking competitors, several of whom call North Carolina home: Bank of America and Truist.

Today SECU serves 1 in 4 North Carolinians. Rather than trying to be a “national” credit union, its statewide focus has improved economic prospects for individuals and communities that are little more than an afterthought for large competitors.

Sustaining success following the iconic 30-year tenure of Blaine required an underrated leadership trait, consistency, one of Lord’s strengths. While he may have had to go outside of SECU for some expertise, Lord continued to promote from within for employee advancement. Front line staff are much more than transaction providers. Some even receive training in multiple areas of financial service, including tax preparation, life insurance and investment counseling, while earning the appropriate license for each discipline.

Traditional media advertising was shunned. The credit union relied on word of mouth and its foundation’s public philanthropy to keep the SECU name in the press. The funding of scholarships for every local education agency in the state, contributing to teacher housing, new hospice facilities and dozens of other projects projected a “brand” deeply involved in members’ communities.

A Cooperative Financial Conglomerate

Describing SECU as the second largest credit union in the US does not begin to define the scope of its member services. With the credit union at its core, the credit union also oversees the following organizations-CUSO’s:

  • SECU Life is the only CU-owned life insurance company in the US. Other CUs which offer insurance do so as an agent for an outside firm;
  • A broker dealer and investment advisor that developed a unique partnership with the low-cost Vanguard mutual fund family for members seeking off balance sheet investment options;
  • A 501(c)3 Foundation that donates over $15 million per year for community needs in North Carolina;
  • A property management company (SECU*RE) that owns and manages 1,500 properties to provide housing, and improve declining neighborhoods, sometimes even selling homes to members. This company is for-profit, taxable and was begun as SECU’s response to the 2009 housing crisis. Its purpose is to reinvest in neighborhoods, prevent bottom fishers from underpaying for foreclosed properties, and provide renters a better choice than local slum lords.

With these multiple business lines come many regulators: NCUA’s ONES and North Carolina’s Credit Union Division of the Department of Commerce, NC Department of Insurance, CFPB, FINRA/SEC, and of course the IRS for the Foundation.

Staying Local While Becoming Larger

With a branch in every county of the state, the credit union’s over 270 locations operate like small credit unions. They provide local employment, knowledge and expertise for every part of the state. Branch managers consult with local advisory boards and often make recommendations for SECU services or foundation grants for their areas.

Lending decisions are all made at the branch level. Branch personnel are intimately familiar with local economic conditions and politics, even in the smallest community. This gives SECU deeper insight into all things economic when making loan decisions and keeps charge-offs way below peer averages.

A Simple Product Profile

The primary purpose of each SECU product is to help members become financially stronger. The credit union’s primary product for helping members build wealth is a variable rate home loan to encourage home ownership. Its loan portfolio is 74% first mortgages.

For over a quarter of a century SECU has made 100% mortgage loans with negligible losses to help lower income and young folks achieve home ownership. Underwriting was based on the common-sense idea that if members pay rent reliably they can be counted on to pay the same amount on a mortgage to own their home. These mortgage loans also invested billions in communities throughout North Carolina’s economy, not just in wealthier big cities.

There is no risk-based loan pricing: each product has a single rate whether a credit card, auto or other lending need. Each loan is based on individual underwriting, not credit scores. SECU’s Salary Advance loan has made billions in payday loans to members at APRs less than 15%. The program, which also has a savings component, fights for-profit payday lenders who prey upon the least advantaged in the economy.

In addition to traditional savings and share drafts, the credit union has $170 million in a 529 college savings plan, $67 million in HSA accounts, and $ 4 billion in IRA/Keogh retirement savings. SECU’s 529 plan is a financial “safer option” for all participants in North Carolina’s college savings program, not just SECU members. That selection says much about the confidence in SECU within the state.

As with loan pricing, there are no savings tiers based on account balances–all 2.6 million members receive the same rate on each product.

Serving the Cooperative System

SECU’s influence extends far beyond its 2.6 million members. Within North Carolina’s cooperative system, the credit union supports others who might reach out for mergers to offer mentoring and resources so they might continue their independent journeys. These operational alliances continue today with Local Government FCU, Latino Community CU, North Carolina Press Association Federal Credit Union and Greater Kinston Community Credit Union.

Greater Kinston is the last survivor of 55 credit unions chartered by the black community during the Jim Crow era when financial services were not open to them. SECU was also a leading fundraiser for the Martin Luther King memorial in Washington, DC.

At a time when many peers proclaim institutional growth as the critical performance objective, not members’ financial well-being, SECU adamantly asserts this is a false dichotomy. Members are the credit union.

As many leaders focus on innovation and the allure of the self-service virtual future, SECU continues the traditional embrace of a face-to-face relationships– for all ages from the newborn to the retiree.

The bedrock of its strategy is the cooperative model with all its inherent design advantages versus other firms. Member-ownership is the unmatchable competitive difference. It implements what writer Ken Wilber calls “good power” in which organizations protect the many who are often at the mercy of the firms they use. He contrasts this “good power” with the instinct of “dominant” organizations that use their position primarily to protect, maintain and promote their success at the expense of others.

SECU proves that size does not dilute cooperative values or purpose. It is a powerful example of the ability to achieve mission and counter the prevailing tendencies of credit unions to become more and more bank-like.

SECU demonstrates that economic, social and political influence can be accomplished by implementing and innovating traditional cooperative principles. Its success validates the credit union system’s contribution for both its members’ financial health and for co-ops as an essential part of the American economy.

Sitting in the Same Place Where He First Began

SECU has been developing system leaders, not only by hiring at the entry level and promoting from within, but also by sending leaders to over 30 other credit unions. Some–Tom Dorety, Terry West, Maurice Smith, and Tom Feindt– ran billion-dollar shops while others migrated to smaller but no less vital firms.

Lord’s career exemplifies this leadership development capacity. In a 2016 interview after becoming CEO, Lord pointed out his office was at the same location where he first began his career 46 years earlier. Albeit in a very different building. Lord’s career exemplifies a critical life lesson, awareness of one’s “true home.”

In a poem called “Little Gidding,” T.S. Eliot ends his quartet by writing:

We shall not cease from exploration
And the end of all our exploring
Will be to arrive where we started
And know the place for the first time.

Lord is the rare exception to Eliot’s observation of human nature. For without exploring, he knew the place he belonged, from the very first time he arrived.

A CEO’s Current Analysis—and How to Respond

As I write this, we’re deep into preparations for our 2022 business plan and budget. We’re in the mood to look forward and say, “yesterday’s numbers are yesterday’s numbers.” And, as of June 30, yesterday’s numbers are spectacular.

I could wax on about all of the effort, the good luck, and the wonderful contributions of everyone involved. Credit unions put forward the capital and embrace our alliance; we go about our day-to-day business; and the results are great.

But I have a nagging feeling about the future. We all have the sense that we’re making money by hunkering down, by avoiding aggressive investment, by just riding the wave of a national COVID approach that will leave us hanging in the future.

American citizens will all have to wake up and face the day after all the free money expires. As American businesses, that means we are going to wake up to consumers being resentful about how hard life is, the day after the COVID relief funding ends.

I wonder what a marketplace of resentful consumers means to credit unions. I wish I had a crystal ball and could tell you exactly what it means, but I don’t. I can only tell you what we’re planning for 2022 and how we hope that will pay off in the coming years.

    • We’ll have to be more aggressive about investment and think hard about what we’re committed to as a community of credit union operations. We need to fuel the future with investment. The hunkering down is over.
    • While we have a bit more time to analyze business trends related to the COVID pause, we’ll have to quickly identify the game-changers that will last, versus the over-reactions and over-estimates of how things like remote work will affect our future. We can’t throw out the baby with the wash based on an interruption in economic models. What will we count on? What will we bet on? What will we make work? I’m not sure it’s going to be as radical in the next two years as most people think. We have options if we’re patient. We have a future if we don’t shoot ourselves in the foot.
    • We’ll have to avoid being disappointed by the fact that COVID might not end as cleanly as we all hoped. We’re making progress, but that progress may not be without some setbacks. Things like vaccines, wearing a mask, and social distancing might not just end, never to be seen again. It may feel like these issues linger right through 2022 and 2023, like a bad hangover after New Year’s Eve. Optimism, and a realistic evaluation that things are getting better, will have to rule the day for business planners.

Wow! These three marketplace realities confront every in-place or new leadership team.

The pressure will be high to pick the right investments, to choose the right trends to run towards, and to maintain an optimistic viewpoint, when pessimism is all around. No easy missions for any CEO.

The pressure is not on a single individual; it’s on a network. For a network to work, we all have to help our peers be successful by contributing to each other’s success. If you want to contribute to our CUSO’s success, spend a few minutes thinking about how each of us can be the person who helps us all avoid dropping the ball.

The numbers as of June 2021 are great. The predictions for September 30 are as positive as any year I can remember. My faith in the future is constant, given my faith in all of you.

Source: Randy Karnes, CEO, CU*Answers, used with permission

Coop Design’s Two Unmatchable Advantages

Living in a forest sometimes keeps participants from seeing the factors that create its growth.  For the credit union system, there are two areas where they should have the upper hand in the ever-changing world of financial options.

Ownership Matters

We live in a commercial, social and political world in which success is often attained by accentuating differences–through branding, sloganeering or pandering to individual fears.

Cooperatives are built on peoples’ need for community. Instead of fueling division, credit unions rely on shared effort. When people feel included, these efforts build ownership. Ownership is more than “I am a member of.” It is being a part of something bigger than oneself.

Members are choosing a financial option that promotes individual and local opportunity, trust and prosperity.  The inclusive spirit of owning integrates diverse needs and persons in mutual efforts for a better community.

The Power of Relationships

In a brief article on managment strategy author Greg Satell references a McKinsey study that points out the change in the asset composition of leading American firms and why this requires a different approach to leadership:

“In 1983, McKinsey consultant Julien Phillips published a paper in the journal, Human Resource Management, that described an “adoption penalty” for firms that didn’t adapt to changes in the marketplace quickly enough.

. . .research shows that in 1975, during the period Phillips studied, 83% of the average US corporation’s assets were tangible assets, such as plant, machinery and buildings, while by 2015, 84% of corporate assets were intangible, such as licenses, patents and research.”

By NCUA rule, credit unions’ “tangible” assets-buildings, equipment and fixed- are limited to 5% of assets or less.  The structure of loan and investment assets is self-liquidating.  As with other corporations, the most vital cooperative “assets” today are intangible, but not patents or research. It’s about people.

One of these is employee culture especially when credit unions define their competitive advantage as service.  But the most valuable and hardest to quantify is the member-owner relationship.  This is more than the total of product balances, length of membership or volume of transactions. Relationship is members’ ongoing belief that a credit union’s decisions are in their best interest.

When a credit union’s most precious advantages are intangible, effectiveness is directly connected to people — what they believe, how they think and how they act.

This strategic imperative is counter to prevailing themes that coop competitiveness is finding the best technology, skill with data analytics or AI applications, or the dominate theory that size is essential for success.  All may help to some degree, but are not unique coop advantages.

Ownership and relationship are two sides of the same coin.  Without either, the member becomes just a customer, and the credit union one option of many in the financial forest.

The Network Advantage

Satell’s article highlights another credit union system advantage, albeit not unique to coops:

“Yet there is significant evidence that suggests that networks outperform hierarchies.

Wherever we see significant change today, it tends to happen side-to-side in networks rather than top-down in hierarchies. Studies have found similar patterns in the German auto industryamong currency traders and even in Broadway plays

The truth is that today we can’t transform organizations unless we transform the people in them. . .It is no longer enough to simply communicate decisions made at the top. Rather, we need to put people at the center and empower them to succeed.

Later this week I will present the story of a CEO and credit union where these cooperative ideas are the center of every effort.  The results speak for themselves, even if the model appears traditional.


Are App Platforms the Future of Financial Services?

COVID  accelerated the online movement  for all aspects of social and economic life.  In credit unions, some assert the transition away from the branch-based model of financial services to an all virtual one is now inevitable.

One example of this total virtual embrace is the former United Airlines, now Alliant CU with $14 billion in assets. It has no branches and is the ninth largest credit union in the country.  In contrast the $8 billion Wings Financial whose initial sponsors were also airlines, still has 30 branch operations in airports as well as in the communities surrounding its home office of Minneapolis-St Paul.

The Startups

Multiple startup financial providers, relying solely on virtual platform services, are attracting venture capital and IPO attention.   As described by Ron Lieber of the New York Times, What’s in a First Name for the New Money Apps:

The start-ups’ interfaces are indeed generally slicker and simpler, very much a welcome change.

And if you resent all of the overdraft and other fees the big brother banks so often charge — and you do, there’s little doubt — Dave and friends look even better. They tack away from old-fashioned bankery, with a suite of offerings like advance access to your paycheck, overdraft fee avoidance and assistance building credit.

Their brand’s “personalization” is communicated with  first names like Dave, Marcus, Albert or Bella.  Or sometimes with a disruptive promise like Aspiration and Revolut.   One online offering called Simple was just that, and has already closed.

The Enduring Advantage

While distribution options and transaction volumes migrate to virtual self-service, that does not mean branches will go away.  They may decline in traditional teller transactions but become more vital for other service interactions

Credit unions are organized around a “community” of people versus organizations built with venture capital.  Their cooperative advantage is relationships which are also the core of their organization’s purpose.

The value of human touch is often lost in AI automated interfaces, text messages, self- service applications and video demonstrations.   “People seeking financial service” as one consultant expressed, “do not visit branches, they visit bankers.”

Moments of Impact

Times’ writer Ron Lieber ends his review of virtual financial apps with the following story:

Davy Stevenson, the vice president of engineering at Hasura, which helps software developers more easily build applications using data, was an early neobank adopter herself. She experimented with the first versions of Simple, which no longer exists.

Today, she banks with her humble credit union. Though she pines a bit for the technical wizardry that her software developer brain knows the institution could deploy, she’s also happy with the way the people there treat her.

One CEO in his monthly staff updates includes examples of this member service advantage.  Here is a member comment from the July newsletter:

Dear (CEO’s name:)  (employees and cu name omitted)

Customers probably contact you when you when something goes wrong. Not this time. I wanted to let you know when your customers are given the best customer service, which is just what I received from the CU recently.

Two ladies I dealt with recently are the epitome of the great people on your staff. The first was J., and I apologize that I didn’t get her full name. J. was extremely knowledgeable in helping us transfer money to a friend living in England. She insisted on staying on the phone as I processed the transfer. She was so polite, helpful, and extremely efficient and I wanted you to know that!

Then, around the same time we were also processing a loan for an RV we were buying. M. B.  processed our loan so professionally and politely that I felt you needed to hear about her also. She instantly took care of everything and two old people are now ready to hit the road! Another great CU employee!

The Humble Credit Union

As long as members remain the mission, the future is secure.  Even when that future is increasingly enabled with Internet Retailing.


The Cost to Members of Overcapitalization

The concept of an “overcapitalization bias” in the credit union system was the topic of yesterday’s post.

One comment from financial consultant Mike Higgins showed how to calculate the cost-that is money taken from members’ pockets.  Here is his analysis:

I’d like to bring some specific concerns to the table for discussion on raising credit union capital.
The proposed regulation establishes a phased-in 10% net worth floor.  We all know that credit unions will carry a buffer to avoid going below the floor – most likely in the 1.0% to 2.0% of assets range.  So, the new net worth standard from a practical basis will be 11.0% to 12.0%.
This creates a huge safety reserve, before any consideration for CECL.  Recall that loan loss reserve is effectively net worth too, just specifically earmarked to cover anticipated loan losses.
For perspective, there are 600 credit unions with assets greater than $400 million that have net worth below 11% as of the 3/31/2021 call report.  I specifically included credit unions greater than $400 million because they will have to prepare for the higher capital standards as they approach the $500 million threshold.
The current low interest rate environment is making it difficult to accrete capital via asset growth.  This fact must be considered as part of the discussion.
Any net worth requirement is a tax on asset growth.  Raising the net worth requirement increases the growth tax.  For example, a credit union growing 10% per year with an 8% net worth target must produce a ROA (profit taken from members) of 0.80% to maintain its net worth ratio.  If the net worth requirement increases to 11%, that same credit union must now produce a 1.10% ROA.
Credit unions that cannot produce the higher ROA to support the new net worth target will have their ability to grow and serve new members stifled.  It will also make it more difficult to invest in the cooperative to maintain market relevance.
In a perverse twist, credit unions may have to take more risk because of the proposed regulation to produce the higher ROA necessary to maintain net worth.
Ultimately, a higher net worth requirement harms the people credit unions are designed to serve.
I am genuinely concerned this regulation is a gift to the competition because it erodes the advantages credit unions currently hold in the marketplace.  The concept of evaluating risk to determine necessary reserves, especially in outlier situations, is important, but I agree with Chairman Hood, it should be used as a tool and not a rule.

The Overcapitalization of the Credit Union System

Twenty-five responses were filed responding to NCUA’s request for comments on the appropriate NOL cap for the NCUSIF.  One provided an insightful context for their remarks.

This excerpt from the Ohio Credit Union League  points out a larger industry bias.  This observation is especially relevant in view of NCUA’s proposal to raise the well capitalized standard for credit unions over $500 million in assets.  This new net worth option called CCULR, would raise the well capitalized compliance standard 43% in two years, from 7% to 10%.

Here is their partial comment:

. . .we wish to register a general objection to the notion of unnecessary over-capitalization of the credit union system wherever such an idea takes root. Except for a relatively small proportion of outliers, where ordinary supervision serves as an appropriate intervention, credit unions themselves are strongly capitalized to the extent that the primary buffer (natural-person credit union capital) against shocks to individual credit unions or the credit union system, is deep and broad.

Prior to the pandemic (December 2019) the average total capital ratios for U.S. and Ohio credit unions were 11.87% and 11.89%, respectively. As the pandemic began receding (March 2021), these metrics remain thoroughly robust (10.51% and 10.53%, respectively) despite the tremendous stresses of a global pandemic, global recession, and stimulus-driven ballooning balance sheets. The abundantly healthy capital levels and ratios in credit unions served the intended purpose quite effectively and in essence, shielded NCUSIF from material impact.

The regulatory process, perhaps beneficially, engenders a bias for more capital at the credit union level (seemingly, ever-stronger balances and ever-higher ratios). Yet this bias must be tempered by business discipline to ensure that capital balances in credit unions and in the NCUSIF remain strong but not excessive, so the various costs of capital are reasonable (even supportable).

To the extent that we witness what appears to be strong NCUA bias for more capital (unnecessarily larger balances and unnecessarily higher equity ratios) and noting the nexus of this concern to NOL strategy, we draw attention to the potential disruptive and costly over-capitalization of the credit union system at the credit union level, in NCUSIF, and particularly in combination. In this context we reiterate our call for the return of the NOL to its previous strong and proven level of 1.30%

Amen

When Leaders Lack Confidence in their Organization

What would you think if you learned that Warren Buffet was shorting Berkshire stock? Or Elon Musk prefers driving a Lexus?  Or Jeff Bezos doesn’t want to test fly his Blue Origin Space capsule?

None of these situations is true.  And because the opposite is the case, observers’ trust in these leaders and their organizations is sustained.

A Credit Union Example

Seven years ago, in October 2015, NCUA over the objection of board member Mark McWatters, approved a final 424-page RBC rule. This was NCUA’s second attempt to impose this new reg which was as equally unsupportable as the first.  Both attempts were universally opposed by credit unions.

One of the rationales for the rule stated in the 2014 NCUA Annual Report was “the issuance in 2013 of new risk-based capital rules by the FDIC, the office of the Comptroller of the Currency and the Board of Governors of the Federal Reserve System.” (page 12)

Certainly, an impressive endorsement by banking regulators.  However, in September 2019 the FDIC with the full concurrence of the Comptroller and Federal Reserve removed RBC requirements for all community banks under $10 billion.  Did NCUA follow its peer’s decision? No, It plodded on, kicking the can down the road even though one of their primary justifications was gone.

What the Rule Says About NCUA’s Self Confidence

But there is another insight, besides bureaucratic obstinacy, to take from the final proposal.

The agency published a two-page summary — Risk Weights At a Glance –as the final summary of absolute and relative risk of every possible balance sheet asset. Three judgments are illuminating.

Credit unions investing in the capital of the CLF have 0 risk.  Since the CLF has not made a loan for over a decade, it suggests how the agency is thinking about the CLF’s role assisting credit unions in the future.

The FHLB’s do make loans to credit unions. To qualify for these, a credit union must buy stock in the bank. NCUA determined these stock purchases should be assigned a 20% risk weighting.

Even though no FHLB organization has ever failed, the agency believes there is still a small risk.  But it is nowhere near the risk of a credit union investing in a CUSO, which requires a 100-150% weighting.

But the most ominous risk is for credit unions’ 1% capital deposit in the NCUSIF.  According to the chart, the 1% deposit cannot even be counted as an asset.  It must be subtracted in full from the numerator of the credit union’s net worth and from the denominator’s total of all risk weighted assets.

It is counted as having no value despite having been untouched for almost 40 years.  It is an earning asset, withdrawable in a voluntary liquidation or conversion to private insurance. On both credit union and NCUSIF balance sheets it is carried at full value.  Multiple national accounting firms have stated this asset “fairly presents” both aspects of this transaction.

What would subtracting this asset mean for the NCUSIF’s Risk Based Capital ratio!  If credit unions cannot count this as an asset, how can NCUA include these deposits in the NCUSIF’s net worth?

One interpretation is that this is just one of many foolish aspects of the final RBC rule which becomes effective January 1, 2022. But there may be more intention than one might think.

A Scary Thought

This NCUSIF total write-off of the 1%  from net worth, like the hypothetical made up examples first above , points to an uncomfortable reality.  This is an agency whose leaders lack confidence when managing the ever growing resources credit unions provide.  And if they lack the understanding of this cooperative fund’s operations, what message is sent to credit union members?

Today the NCUSIF equity level above the 1% deposit totals over $4.7 billion.  Should a loss of that magnitude or more occur, the primary question will not be about the status of the 1% deposit, but where was the regulator?

The cumulative loss rate for he NCUSIF over the past 12 years and two financial crises, is 1.5 basis points.  To project a loss at least 20 times this recent real world experience, is deeply troubling. (2,000 percent, i.e. 30/1.5)

That potential accountability is why the agency wants to eliminate the 1% from credit unions’ net worth today.  NCUA wants to avoid explaining how its oversight allowed such a situation to develop.

Now that is a scary thought.


What is the Value of a Strategic Plan?

Jim Blaine, former CEO of State Employees Credit Union North Carolina wrote:

Credit union strategic planning is about as useful as Bermuda’s long rang plan for global domination

Some very successful CEO’s have focused on operational performance as the best road to the future.   And done very well.

The Role of the Plan

Most credit unions will not follow Jim’s observation.   Planning is an annual ritual, often the key part of a board retreat.

These plans are a way of communicating within the organization and when necessary, to external stakeholders.

What matters however, is performance results, not the paper intentions.  Until outcomes are identified and tracked, a plan can be just a political exercise.

The Benefit of  Paper  

Many plans describe strategic priorities, projects and projections.   The test of these goals should be the questions they appear to respond to, if not stated outright.  Questions can be concrete or qualitative.

For example: how do I know if my credit union is becoming more or less relevant in my members’ lives?  What advantages of cooperative design can we use more fully?  How does my team show pride in what they do?   What is the basis for our future confidence?

Leadership is asking the right questions about the short and long term.  In 1983-1984 credit unions began asking NCUA was there a better way to reach the 1% equity goal for the NCUSIF besides double premiums?   That questioning led to a unique cooperative-inspired outcome.

Answers may be uncertain, but the first step in ongoing success is at least looking in the right direction.


The NCUSIF Tool Every Credit Union and NCUA Should Use

The cooperatively created NCUSIF is an insurance resource designed for all economic seasons.  Whether there are clear financial skies, clouds or even once-in-a-hundred years storm (e.g. the COVID economic shutdown in the 2nd quarter 2020) the structure is flexible, transparent and proven.

Most importantly, its current performance is easy to monitor, by anyone.  It does not require a PhD in economics, 20 years of regulatory experience or even the expertise of a Black Rock.

There are only four moving parts.  There are 36 years of actual data to call upon.  Each component has historical and contemporary data to employ in the model.

The model’s four variables are:

  1. The operating expenses taken off the top from NCUSIF income through NCUA’s OTR process;
  2. Insured losses–there is data for all economic cycles. In the past 13 years and two crises, the cumulative rate is loss rate is 1.51 basis point for each $1 of insured savings.
  3. The yield on NCUSIF’s portfolio reflects the staff’s investment decisions, and is semi-fixed in the short term due to its current weighted average life of over three years.
  4. Credit union insured share growth. It is reported quarterly.  The most recent 13 year CAGR is 7% even including 2020’s unusual rate of 22%.

The Model Demonstrates A Better Way

In 1984 credit unions and NCUA worked together to create a cooperative fund that would be A Better Way than the failing premium-based systems. This dynamic model shows how this financial design works and more importantly how it can be even better managed today.

The model has two key capabilities.  It dynamically links the four financial variables so that any input change automatically recomputes all outcomes.

Second it translates the variable input measures into understandable, actionable data.  Converting historical insured loss experience (bps), rates of share growth and investment yields(%), and operating expense ($) into one integrated financial design ensures the model always aligns with the size of insured risk.  For example 1 basis point loss in 2010 is $76 million; however in 2020, that same loss rate is $144.5 million due to the growth of insured shares. The model’s output is provided in all three measures: $, % yields, and basis points to easily understand the options for the yearend NOL.

Events have demonstrated that NCUA’s NCUSIF models used in 2017 through today are not based on any objective reality.  The so called scenarios are financial myths developed to support NCUA’s desire to remove the guardrails on the most successful deposit fund ever managed by the federal government.

The Dynamic Spread Sheet

This is the link to view the xcel calculator with the numbers used below.  To enter your own numbers, feel free to make a copy (open this view-only copy with google sheets, click File, then Make a Copy).  Using your copy will automatically calculate the yearend outcome with your inputs.

Models are not answer machines. They inform judgments.  They require objective validation.  When used properly, they identify options and improve management effectiveness. The following is the example shown in the “view-only” model link above.

An Example With Actual Data

The audited yearend NCUSIF data from December 31, 2020 is entered in the view-only example. This includes the audited reserves ($4.7 Bn), insured shares ($1.467 Tr), the reserve ratio (.318) and a 2021 yearend goal for this ratio (.30).  With the 1% credit union deposit, the spread sheet calculates the performance required to reach a 1.3 NOL at 2021 yearend.

The columns E, F, G and H are four variables that can be updated anytime.  I have entered both current numbers and informed estimates.  For share growth I used the first quarter’s annual rate of 23%; for loan loss I entered .5 of a basis point which is below the long term 1.51 rate because to date, the NCUSIF has reported net recoveries.

For total investments I have added the increase in 1% deposits from the year end true up and a mid-year estimate.  However, the portfolio’s size is not increased 100%, reflecting that these additional deposits will only earn for 9 and 3 months, respectively.  The $190 million expense total is higher than 2020’s expense and uses the 2021 budget modified by actual results through May.  Finally, for the yield, I entered NCUSIF’s current year-to-date portfolio return, 1.27%.

The five green columns show the projected yearend outcome from these inputs.  The required portfolio yield is 5.28%, way above the current yield.  This shows a yearend NOL of 1.257.  To raise that outcome to the target 1.30 level would require a maximum premium of 4.33 basis points of 2021 yearend insured shares or $782 million—if nothing changes in these input assumptions.

That certainly seems a dour result in this relatively stable and growing economic climate.  It does not necessarily require a premium. At numerous points in the past when the NOL ended below the 1.3% cap, NCUA has foregone a premium at yearend, most recently in 2016 ending  with a 1.24 NOL.

A Different, More Probable 2021 Scenario

However, this forecast and assumptions are an unlikely outcome. Extraordinary share growth is driving this result.  The rate is already slowing.  June and September call reports will provide a more relevant number.

For example, if insured shares grow at the 13-year average of 7%, then the results are totally different.  The required portfolio yield would be just 1.6%, and the year-end NOL, without any premium, is 1.296, almost at the 1.30 cap.   Further, if there were no insurance losses (zero loss provision), and only continued recoveries, the yearend ratio would be 1.308, above the NOL target.

It’s Not Rocket Science

Credit union CEO’s and boards are living daily the operational experiences underlying these inputs.  They know industry growth trends, delinquencies and certainly have a feel for interest rates.  Their input assumptions can be informed by their real world understanding, not guesses about the future.

This simple model should empower every credit union to evaluate the information and NCUSIF projections used by NCUA. Responses should be formed from their expertise and data, not unsupported opinion.

But more importantly, anyone who uses it will understand the flexibility and viability of the NCUSIF’s cooperative design.

Every year the NCUSIF automatically grows at 80% of the share growth rate via the 1% deposit true-up (1/1.25).

If insurance losses, share growth or yields fall outside the long-term credit union system’s experience, then a premium is an option to maintain a targeted reserve ranging from .2 to .3.  There were many adjustments to the NCUSIF equity during the 2008-2020 period.  However, the two premiums in 2009 and 2010 averaged only 1.3 bps annually over these 13 years.

The Yield Calculator as a Management Tool

Another value of the NCUSIF model is using the Yield Calculator and the recent 13-year averages to calculate the breakeven yield on investments needed to maintain an NOL target, say 1.25, or within a narrow range.  One must first convert the operating variables to basis points. Adding the 7% insured share growth rate(1.75 basis points) plus 1.51 basis point loss experience, and the 1.6 bps of operating expenses totals 4.86 basis points.  Dividing this total by the portfolio size of 1.25  (the midpoint of the  NOL)  shows the “breakeven” investment yield needed to support this NOL is 3.9%.

The model clearly highlights the relative importance of each of the four variables.

Operating expenses come off the top of revenue. If the OTR had remained aligned with the proportion of state charters, or 50%, the operating expense share would have been 1.41 (not 1.6) basis points, thus lowering the required breakeven yield.

If share growth were 22%, not the long-term average of 7%, the bps for this variable would increase to 5.5 and the required yield jumps to 6.9%.

 Managing the NCUSIF’s Portfolio

The model demonstrates the importance of monitoring the decisions about NCUSIF’s investment  portfolio. If the current yield 1.27% and 4.86 basis point of inputs were frozen forever, credit unions might have to pay an annual premium of 3 basis points (1.27%-3.9% equals yield shortfall of 2.63%/.8/1.07 = bps premium on the new year end 1% insured share base) to maintain the NOL at a 1.25 breakeven level.

Informed oversight of the NCUSIF’s portfolio decisions is a vital responsibility of NCUA  management and board.  Market rates change. In the interest rate trough of this economic cycle, should NCUA be making 8-year fixed term investments for a 1.26% yield (April 2021) when knowing the breakeven goal for NCUSIF is  3% to 4%?

On November 18, 2018, the yield on the two-year treasury bill was 2.98%.  Today the yield is .26%.  If NCUA’s investment managers are supporting the NCUSIF’s financial model, should they be routinely  filling out an investment ladder up to 8 years in this part of the economic cycle? Common sense says no—this will reduce NCUSIF’s income, shortchanging credit unions years into the future.

The economy is at an historical low point in this interest rate cycle.  The dominant economic topic today is the inflation outlook.  Are price increases here to stay or a transitory event?  Whatever the outcome, realistic judgment suggests that rates will be higher 6-12 months from now–the only question is how much higher. An example of this change prospect  from the past ten years is that the peak in the 5-year treasury yield was 3.07% on October 1, 2018, just two and a half years ago.

Tools Are Only as Good as the User’s Skills

Every credit union uses spread sheets.  This model is a simple, automatic xcel tool-just add your own judgment.  All the variables are in the formulas.  Some inputs are set; others easy to project.

Interpreting the outcome(s) is the art.   Bias will sometimes cloud these judgments. That is why it is vital that commentators on NCUA’s request for NOL comments document opinions with factual underpinnings and an understanding of how special this coop fund is.

Good luck with the model; critiques/questions are welcome.  Tomorrow I will suggest points to make by credit unions responding to this NCUA’s NOL request.

Facts vs. Fictions: the NCUSIF Financial Model Works—Even When Mismanaged

This is the third of five articles looking at how the NCUSIF financial model has performed during the past 13 years, even the times when it has been mismanaged.

NCUA’s request for comments on NCUSIF’s NOL assumes the core model of a .2 to .3% level of retained earnings on top of the 1% credit union underwriting is inadequate. Chairman Harper openly states this view. The facts going back to 1984, or 36 years of operation, show otherwise.

From 1984 through 2007, the NCUSIF’s financial model delivered the results promised. Losses were minimal, there were dividends in a number of years; premiums assessed only twice; and the NOL easily maintained in the .2 to .3 range.

So successful was the model that the fund paid six consecutive dividends from 1995 to 2000 and again in 2006 and 2008. It would have distributed more except NCUA changed the way it calculated the NOL by excluding the required yearend true-up of the 1% deposit beginning in 2001.

The following graphs are based on NCUSIF’s audited statements for the years 2008 though 2020. This 13-year span is used because it includes the two great post-Depression systemic financial crises and years of historically low interest rates to prod recovery. Here is what the data shows.

Coverage for Insured Loss Risk

Throughout this period, the cumulative actual losses were 1.51 basis points of insured shares. In five of these years, losses were less than 1 basis point. In 2020 cash recoveries exceeded losses.

During the 2008-2010 Great Recession actual losses never exceeded 3.5 basis points. The peak year in losses was 2018 at 7 basis points, when NCUA liquidated the taxi medallion conserved credit unions.

The year-by-year actual loss and the cumulative long term loss experience of 1.51 basis points are shown below. The normal NOL range of 10 basis points is almost 7 times greater than this historical average.

However, NCUA’s accounting estimates for loss provision expense, on a year-in year-out basis, have no correlation to actual events. This provision expense is shown in annual reports as “insured losses” and creates a very misleading presentation.

The graph below shows that the provision account has been at times funded at a level 10 times (1000%) greater than the following year’s actual losses. In credit unions, the allowance account ranges between 1 and 1.5 times actual losses.

The result of this misleading loss provisioning results in dramatic swings, from an expense of $737 million in 2010, to a reversal of $526 million in 2011, a total of income statement impact of $1.3 billion in just two years.

The graph below shows how these mistaken estimates create wide variance in reported net income versus the actual insured losses. These exaggerated loss provisions were the basis for assessing unnecessary premiums rather than informed judgments based on historical loss experience and a common sense view of current events.

NCUSIF Operating Expenses Exceed Insurance losses

Over the past 13 years, NCUA has charged the NCUSIF $2.2 billion in expenses, an amount $270 million greater than all insured losses of $1.9 billion for the same period.

The result is that NCUSIF has become the primary funder of NCUA’s operations, rather than the operating fee intended for this purpose.

The graph below shows that in eight of the past 13 years, operating expenses have been greater than insured losses:

This outcome is because over 93% of NCUSIF’s operating expenses are from the Overhead Transfer Rate (OTR). This transfer charge has ranged from a low of 52% (2008) to as high as 73.1% (2016) of the agency’s total yearly spending.

The combination of these arbitrary changes in the OTR (State chartered federally insured credit unions have never exceeded 50% of the insured base) and wildly inaccurate loss provisions, illustrate the difficulty of relying on NCUA’s financial reports to assess the sufficiency of the NCUSIF model.

In fact, a reasonable interpretation is that the model has functioned well despite significant missteps by NCUA.

NCUSIF’s Total Yearend Reserves are Much Higher than the Reported NOL

Since 2001, NCUA has not included the yearend true-up of the 1% required credit union deposits when calculating the NOL. The result is to understate the actual NOL. It is easy to calculate the actual reserves above the 1% deposit contributions by dividing the reserves by insured shares.

When this is done as shown on the chart below, the actual NOL is always greater than the number NCUA reported. In some years the difference is over 5 basis points.

For example, in 2020 NCUA reported the NOL was 1.26% whereas the actual number was 1.32%. Each basis point of 2020 insured shares is $144 million. This belated true-up practice substantially misrepresents the NCUSIF’s actual financial condition.

Moreover, by adding the allowance for loss (already expensed) to the retained earnings, the actual dollars and margin in bps for covering losses is greater than the just ending NOL. As shown below, the reserves plus allowance account have exceeded .3% level (or legal cap for a premium) for the NCUSIF every year since 2008. In 2017 this total reached a peak of 55 bps or 25 bps higher than 1.3%.

Federal GAAP Accounting Further Confuses NCUSIF’s Presentation

The NCUA board’s adoption of Federal GAAP standards for NCUSIF reporting in 2010 created two additional transparency problems.

Federal GAAP does not report retained earnings/reserve in the same manner as private GAAP. The reserves called Cumulative Results of Operations include any change in unrealized losses or gains on the fund’s investment portfolio, its largest asset.

The graph below shows how this “valuation” over-or-understates actual reserves by as much as $466 million (2020). NCUA does not use this valuation when it calculates the NOL, but it is the amount shown in NCUSIF’s “net position” in the balance sheet prepared using Federal GAAP.

A second point of confusion is adjustments to prior periods of loss estimates for NCUA’s liquidation estates. As fiduciary assets, these amounts are not included on the “government entity’s” (NCUA’s) balance sheet. Only the net change in receivables is shown.

The chart below shows these prior adjustments to loss estimates total $313 million and are increasing in amounts. These managed assets should be audited, as in private GAAP and not excluded, so these valuations are subject to independent review.

The Resilience of the NCUSIF Model

The data show the NCUSIF financial model is resilient. The combined total of insured losses (1.51) and operating expenses (1.77) are well within the 10 basis point traditional NOL range. This is true even in this 13-year period which includes two major economic crises. This is the actual outcome, not estimates, forecasts or misleading modeling outputs.

To pay this combined expense of 3.28 basis points requires a 2.5 % investment yield (3.28/130) on the portfolio. If insured losses are 0, then the yield for operating expenses alone is only 1.36%. A portfolio yield range of 1.36% to 2.5%, on average, is sufficient to provide revenue for these two costs.

Incorporating Share Growth in a Dynamic Model

However additional income is necessary to maintain the NOL level in line with insured share growth. Tomorrow I will attach a dynamic spread sheet that shows how to easily calculate this required yield incorporating all four variables. Anyone can update and project their forecast for yearend NOL. As a preview, the 13-year insured share growth is 6.9%. Therefore the .30 in reserves would have to grow by this rate to maintain the ratio’s current level, which would require 1.6% additional yield. (2.1/130).

If the retained earnings fall below the traditional 1.3% NOL, then the board can assess an annual premium to this cap if needed. Historically, the board has rarely used the premium just to raise the fund’s balance to the maximum 1.3% cap. Rather, it has left the NOL in a range of 1.25 to 1.29 or wherever the financial results ended.

NCUA’s Calculations Raising the NOL are Suspect

When merging the TCCUSF into the NCSIF in 2017 and again in the December 2020 Board meeting, staff recommended keeping the NOL above the historically proven 1.3% cap. The board did not have this authority until CUMAA passed in 1998 which raised the maximum cap to 1.5%.

During the 2008/09Great Recession and afterwards, the board retained the 1.3% cap. The most accurate statement in the 2017 staff presentation for raising this cap was in the concluding slide: “Actual results may vary from projections.” These same models were again used in the December 2020 board NOL update even though wildly inaccurate compared with actual experience.

The 2017 NCUSIF projections were not due to any fundamental change in the NCUSIF’s financial capabilities or the economic outlook. Rather it was an opportunistic effort to retain as much as possible of the TCCUSF surplus upon merger. These funds above 1.3% would then facilitate the liquidations of two taxi medallions in conservatorship without assessing a premium. Board member Rick Metsger and Chairman Mark McWatters confirmed this in public comments.

NCUA staff continues to use this strained, artificial logic from the TCCUSF merger to keep the NOL above 1.3. Lifting the NOL cap in 2017 was opposed by credit unions unanimously in their comments. But NCUA changed not a single number in their plan. Credit unions were also clear that NCUA should go back to the 1.3% cap as soon as possible if the Board approved 1.39 as the new NOL cap.

In December 2020, staff recommended a 1.38 NOL cap with the same hoary reasoning. They projected a 16 basis point decline of equity in a moderate recession and another 2 basis points from lower corporate recoveries, adding 18 basis points to the 1.2% lower NOL limit.

As in 2017, these modeled numbers are not based on any verifiable data. Why a lower than expected recovery on corporate AME claims reduces NOL is not explained. Projecting a decline in NOL to justify raising the NOL is circular logic.

The staff’s model includes no recognition that the largest expense to the NCUSIF is NCUA’s OTR operating costs. Staff did not use this expense factor when justifying the 16 basis points needed to “prefund” NCUSF equity for a moderate recession.

The NCUSIF is already funded by the ongoing 1% credit union contributed capital.

Dystopian Future Forecasts

NCUA’s models are fictions. Assumptions are not back tested against real world results.

Dressed in real numbers, projections are presented as “future facts” (scenarios), which are unknowable. However these financial myths have immediate consequences for credit unions. The Board bases present day decisions such as OTR expense transfers, premium assessments, capital spending or dividends on these hypothetical multi-year forecasts. Credit unions then pay the price now for incorrect projections which will only be revealed in the future.

NCUA’s dystopian forecasting was responsible for the corporate catastrophe. It led to an incorrect understanding of reserves, underestimated future earnings from investments, and ignored the improving current trends in market valuations.

For natural person credit unions, the most dramatic example of mistaken forecasts is NCUA’s $1.4 billion loss provisions in 2009 and 2010. Actual cash losses for those two years were $373 million. The difference of over $1 billion came out of credit union pockets via premiums.

The year of the worst GDP quarterly fall in American economic history was 2020. Yet, the NCUSIF reported positive cash recoveries, not insured losses. This short lived recession did not impact on equity as projected in 2017. Yet staff still asserted the need for a 16 basis points margin even as the 13-year cumulative insured loss experience declined further to 1.5 basis points.

The dominant issue for credit unions when commenting on NCUA’s NOL request is straight forward. The data show the challenge is not adding additional resources, but rather managing more effectively and transparently those already in place or on call

Tomorrow I will link to a simple spread sheet anyone can use to project outcomes for the NCUSIF. The assumptions entered and data are clear. Forecasts can be updated with real data at any time. The prospect for a premium or dividend is easily seen. A breakeven yield to achieve an NOL target is instantly calculated.