
For over a year in their quarterly Trendwatch industry uupdates, Callahans has shown long term trends using both average ratios (the mean) as well as the median for industry level performance.
The mean is the weighted average outcome for all credit unions. Obviously this approach gives more significance to larger institutions’ trends versus smaller. The median shows the middle number where 50% are below and 50% are above the number being tracked. Here are two examples of these analytical outcomes:
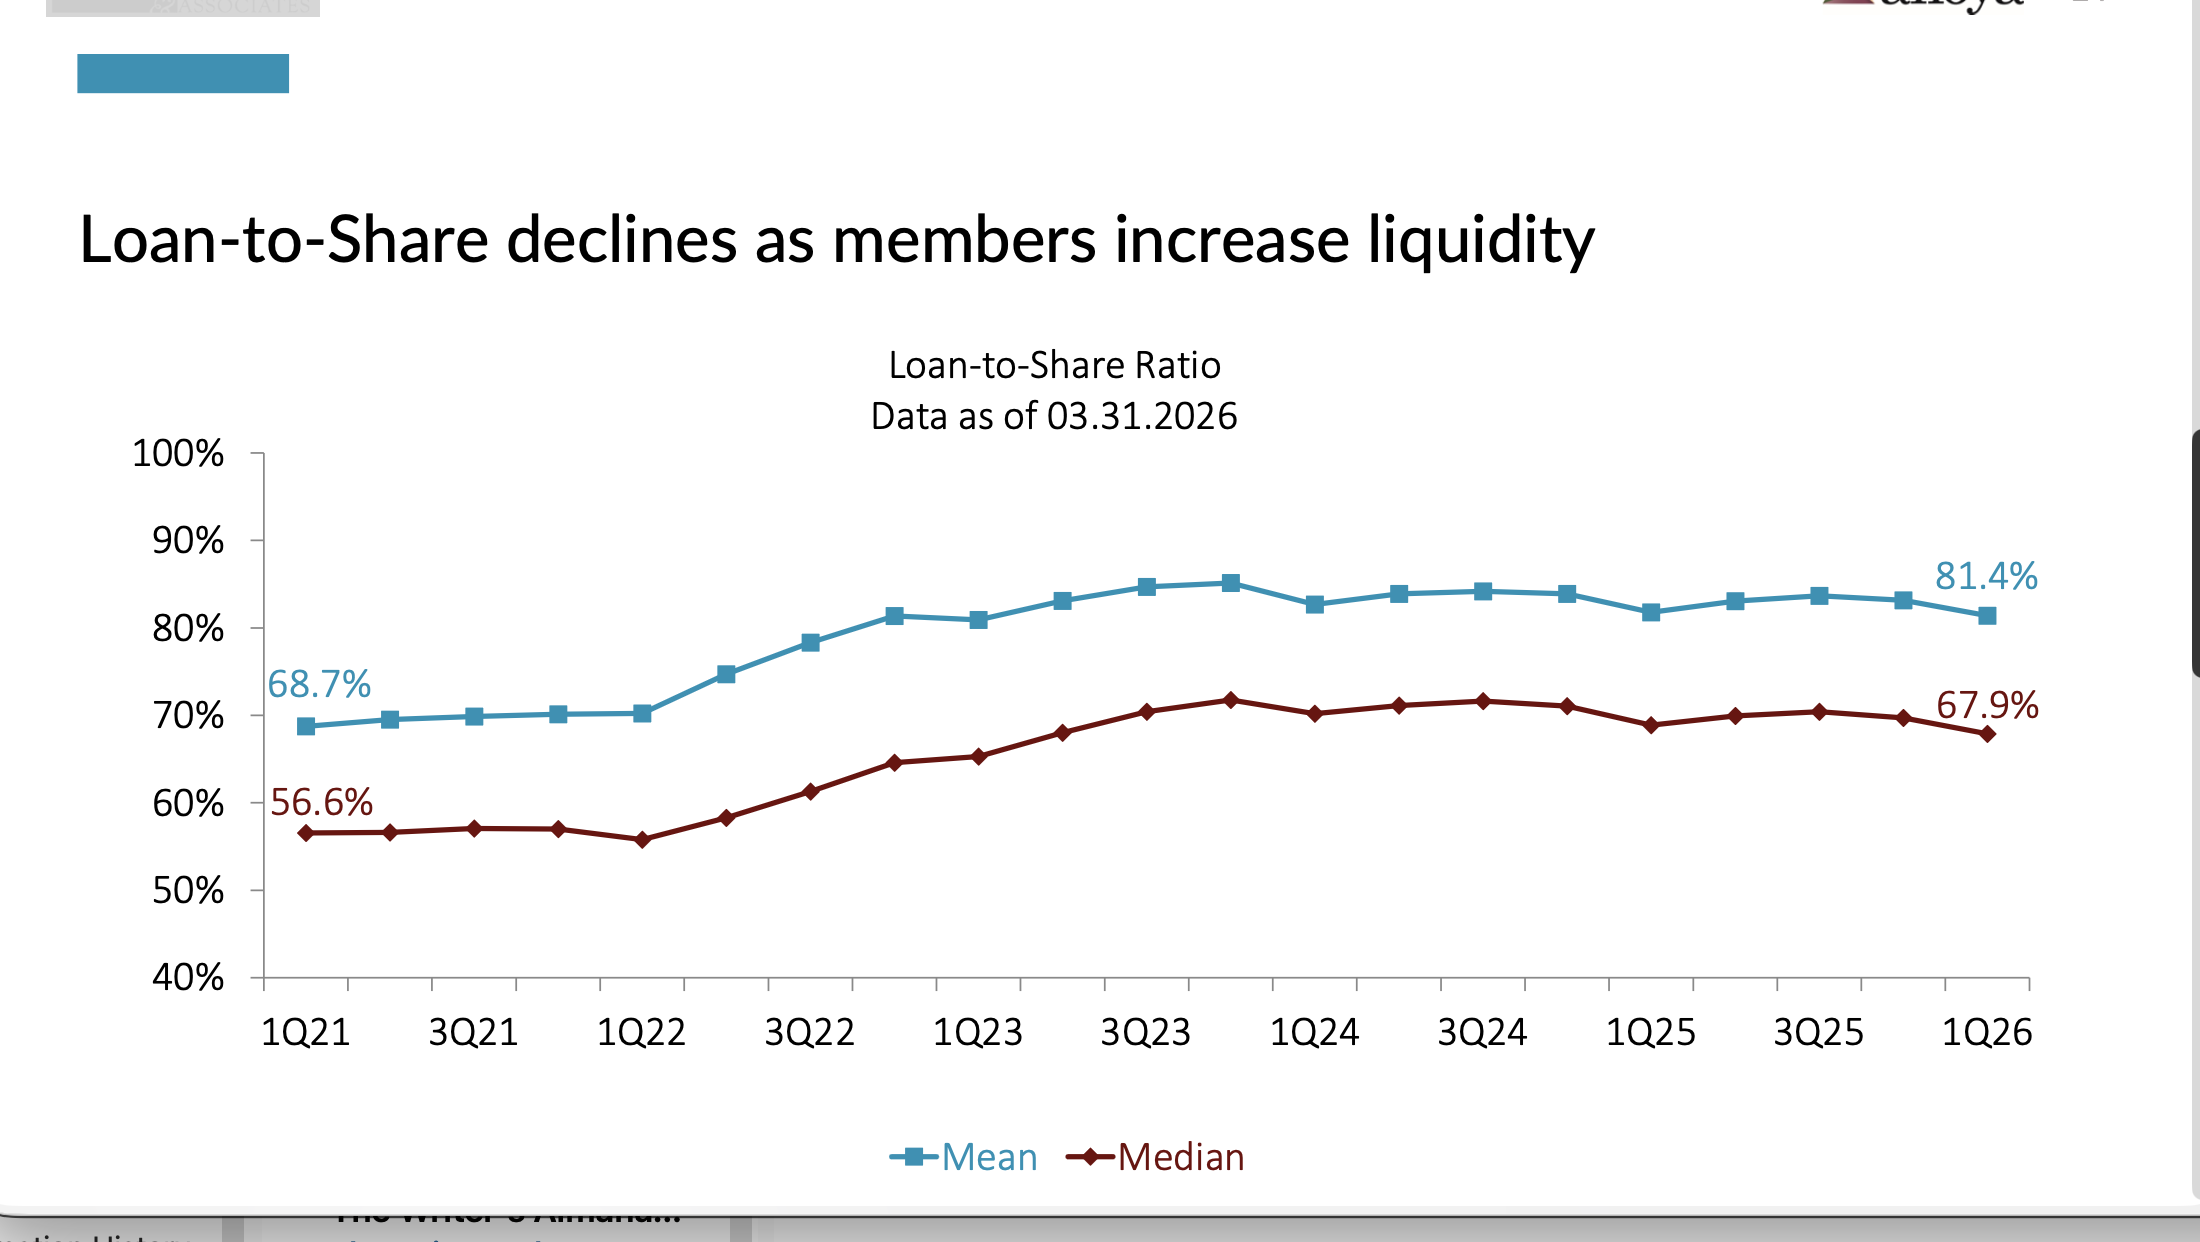
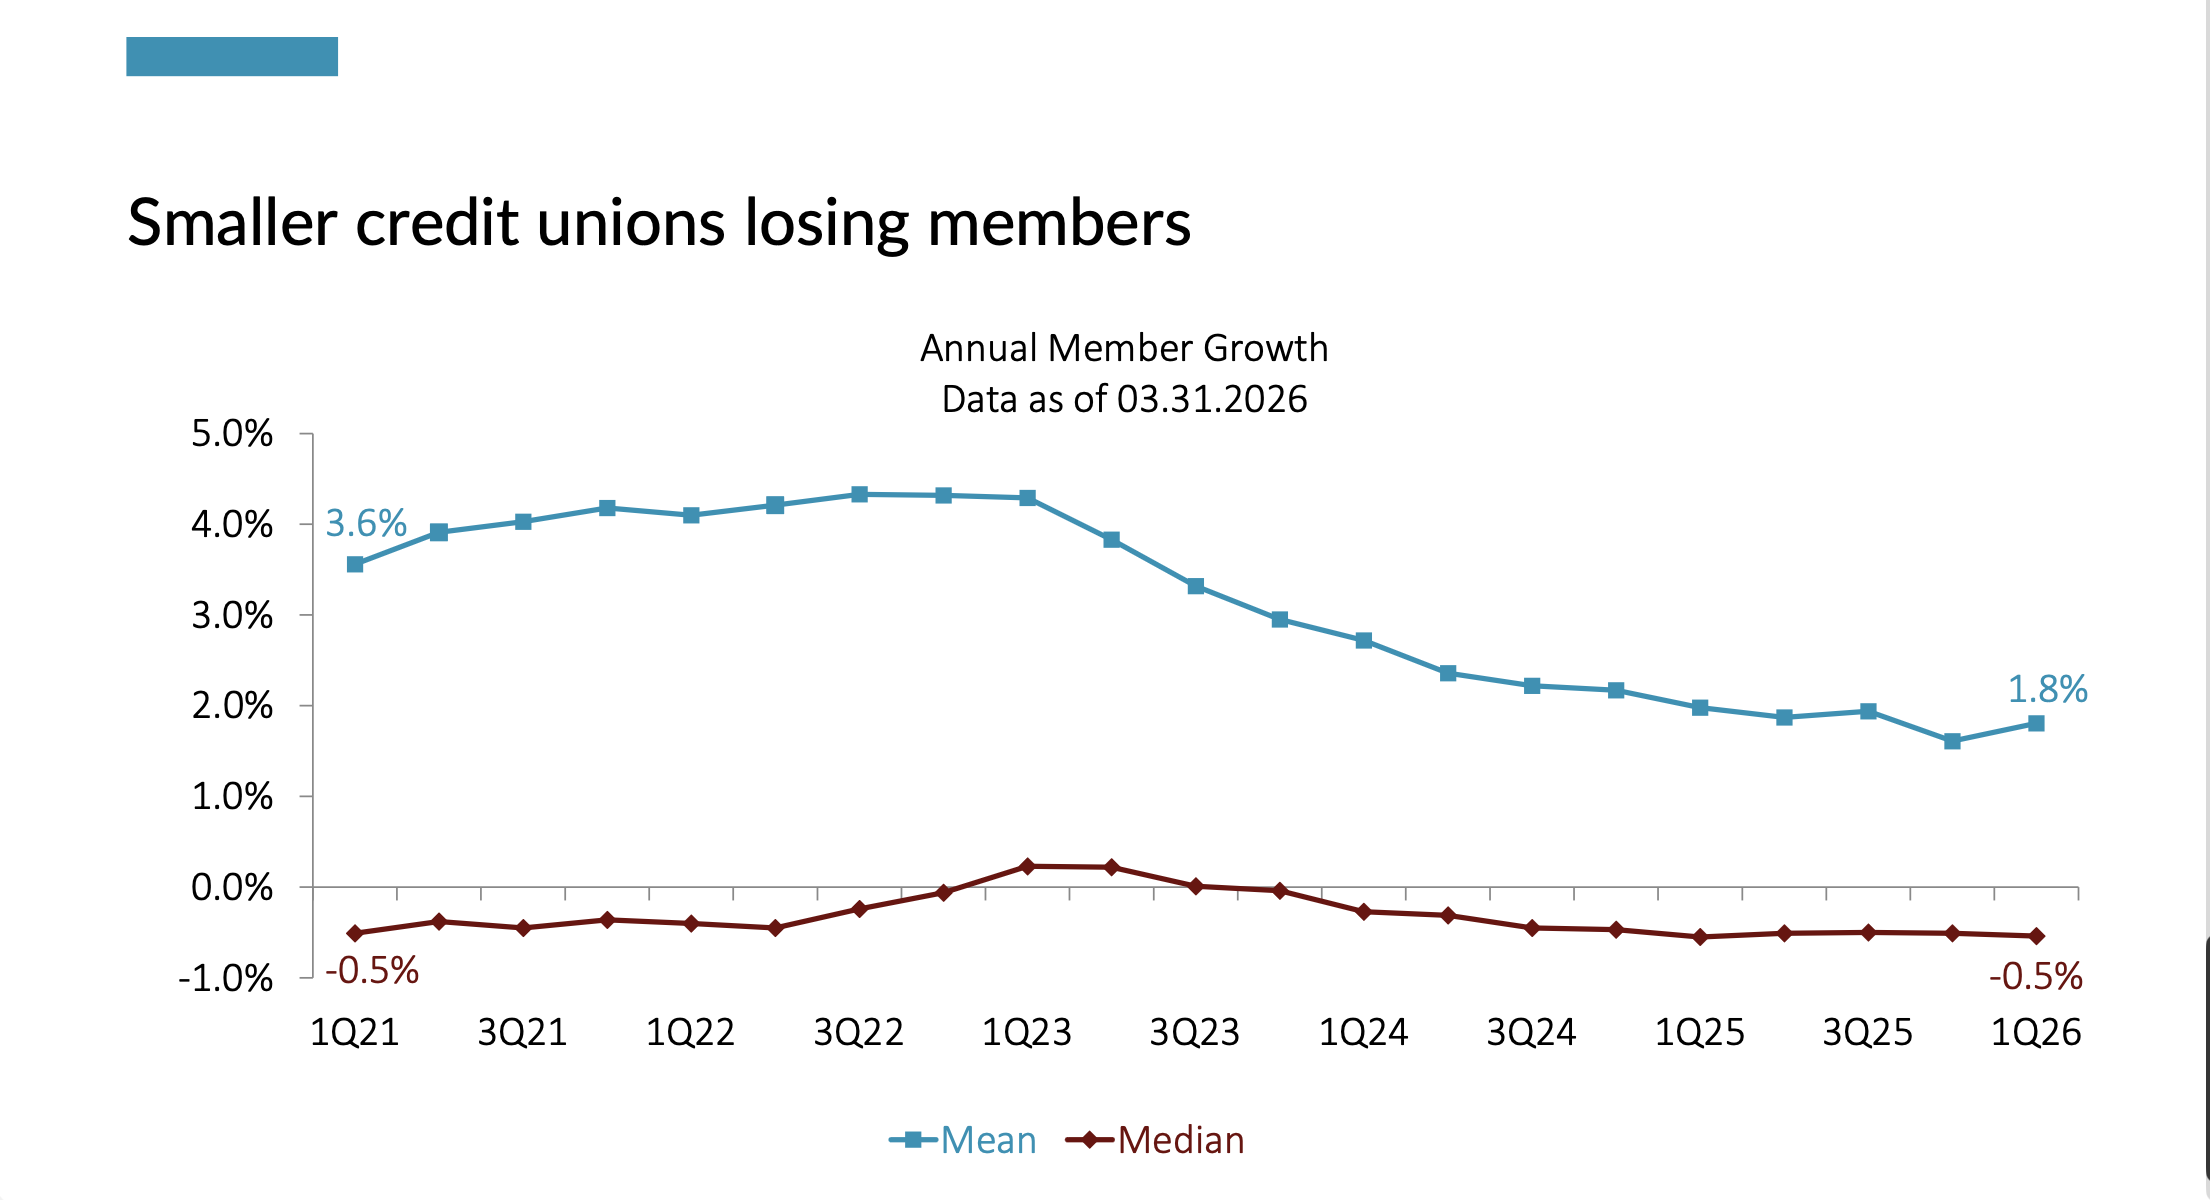
Callahan’s graphs illutrate these different ways to present data. While overall trend lines may look similar, there is a real difference when interpreting individual circumstance or peer comparisons.
The Impact for Credit Unions Member Analysis
Yesterday the web site Visual Capitalist published a chart that ranked the 30 Richest Countries in the World by average wealth per capita, that is total wealth divided by population. The second ranking presented the mean or middle total for per capita wealth.
As one might expect America ranks second in average wealth at $695K per person, behind first place Switzerland at $910K. America’s economy has long been one of the largest in the world in total and per capita. No surprise there. On average Americans are well off.
The second column tells a different story. When ranking by the median, the US number is $69K per person. That is 50% of population has less than that amount and the other 50% more. That number places the US in 28th position out of the 30 countries, just above Greece and Germany.
No other country of the 30 in the UBS Glpbal Wealth Report ranking for 2026 had such a radical difference between the the mean and median average wealth per person.
The US reports the widest distribution in the wealth ownership gap between the very wealthy and the rest of the population.
The Credit Union Implications
This is not a new finding. But it shows the extreme difference when placed in the context of other wealthy nations. Moreover, in America this wealth distribution disparity is growing.
In credit union analysis member participation is often calculated. The result is frequently referred to as the 80:20 rule. That is 20% or a small number of members contribute 80% or more of loans or deposits balances. These generally better off members are a much sought after class by all financial providers because of their impact on the firm.
But is an 80:20 outcome in member relationships where the credit union model is most effective? Has your credit union looked at the mean and median income or net worth distribution of your members? Or in the market(s) you serve? Is the marketing priority to gain more profitable, higher balance members or grow across all income levels?
The critical question is whether credit union business models and practices are contributing to and worsening the wealth gap, or trying to improve community equity? Does a credit union’s fee structure, loan pricing policy and savings rates favor the well-to-do? Do the less well off pay more for loans and earn less on their smaller savings balances?
One former credit union CEO who worked tirelessly to ensure there was not a wealth bias in the coop’s practice was Jim Blaine when he led SECU NC. With his approach the credit union became the second largest in the country. Pricing and fees were equitable for every member.
Measuring mean and median member income could be one of the most important indicators of credit unions fulfillling the movement’s public duty justifying its tax exempt status. Or it might indicate the constant pull and siren appeal of the greater market’s for-profit forces.
How credit union’s respond to America’s growing disparity in its distribution ever increasing wealth could determine the movement’s future, that is either profit or non-profit.