Your Credit Union’s ROA and NCUA’s NOL Request

What if an NCUA proposal could reduce your credit union’s ROA from 3 to 8 basis points per year in perpetuity.  Would you care?  Would you even respond to NCUA’s proposal that had that implication?

This could be an outcome should credit unions fail to reply to NCUA’s request for comments on the policy process for changing the NCUSIF’s Normal Operating Level (NOL).  The continuation of NCUA’s NOL financial modeling incantations and Chairman Harper’s desire to remove NCUSIF premium limits have one goal: collecting more credit union funds.

Comments due by July 26 can be filed here. Or mailed to: Melane Conyers-Ausbrooks, Secretary of the Board, National Credit Union Administration, 1775 Duke Street, Alexandria, Virginia 22314-3428

Three Urgent Points in Response

In previous articles I have documented how multiple NCUA decisions managing the fund have shortchanged credit unions.  To return NCUA’s oversight of the fund to the best version of itself, three critical changes are needed.

  1. Convert all NCUSIF accounting to private GAAP from federal accounting principles. This should require the recognition of the full 1% deposit credit union contribution payable simultaneously with the reporting of insured shares when calculating the NOL. Also, all assets under management in AME’s should be audited and their financial data included.
  2. Discontinue NCUSIF financial decisions based on artificial models using hypothetical assumptions entirely disconnected from actual economic data and NCUSIF performance, which are then “projected” years into the future.
  3. Develop better management tools to forecast the current yearend NCUSIF outlook based on actual numbers and estimates from real events. The goal should be to manage the NOL in the normal range of 1.2 to 1.3.

Dividends should be paid when the fund exceeds 1.3.  If unusual events such as a period of historically low interest rates necessitate a premium, that should be temporary to remain within the normal NOL range.

Credit unions should oppose NCUA’s current financial conjuring process for the NCUSIF’s NOL. Manage to the normal range. There are no objective facts supporting a change to the longstanding legal guardrails on the NCUSIF structure.

The Origins of the NOL Change

The questions in the Board’s May request show NCUA’s intent to continue modifying the Normal Operating Level cap in place since 1984. This first change was made in 2017.  That board decision was based on financial fairy tales.  The purported models used neither actual economic events nor 33 years of audited NCUSIF performance outcomes to change the longstanding 1.3 upper limit.

This 2017 decision occurred in the eighth consecutive year of positive economic growth and credit union stable performance. It was simply an opportunistic money grab to avoid the political embarrassment of a premium.

NCUA fabricated numbers to approve a 1.39 NOL four years ago so that the NCUSIF could keep more of the $2.6 bn surplus when merging the TCCUSF.  If not raised above 1.3, additional dividends would have to be paid as required by the FCU Act.

Both board members publicly stated their approval was intended to retain these extra funds to avoid assessing a premium for the planned liquidation of the taxi medallion conserved credit unions.  Most credit unions objected to the proposal, but NCUA did not modify a single number.

Another proof of this financial artifice is that prior NCUA boards saw no reason to modify this normal limit during or immediately after the 2008-10 Great Recession.  The reason is simple, the NCUSIF worked as designed.

Carrying Forward a Fabrication

NCUA suggests continuing this financial fabrication process indefinitely.

The request for comments specifically lists criteria to “invent”  moderate/severe recession scenarios with characteristics based on NCUA’s judgment, using “qualitative” factors, and extending these assumptions out five years, more or less. The most important factor of the fund’s financial “drivers” is omitted –the agency’s operating expenses from the Overhead Transfer Rate.  In the past 13 years these expenses exceeded insured losses by $272 million.

This parody of a  financial model was used at the December 2020 board meeting to justify retaining a 1.38 NOL. That staff presentation projected a decline (loss) in the NOL of 16 basis points in a “moderate” recession.

This “forecast” was given in the same year as the worst one quarter fall of GDP ever recorded due to the COVID economic shutdown in 2020.  Despite this severe economic shock, the real NCUSIF outcome was that net cash recoveries exceeded insured losses by $10 million this past year. The “model” shown in December forecasted that the opposite should have happened—a big loss not a gain.

During the Great Recession years of 2008-2010, the NCUSIF’s cumulative loss rate on insured shares was only 2.8 basis points, a fraction of the 16 bps loss projection shown in December’s board presentation.

Every question listed in the NCUA’s request has an implied assumption that a larger and more frequent adjustment of the NOL outside the traditional 1.2-1.3 range from 1984-2017 is necessary. The 36 years of actual NCUSIF performance shows that managing within this NOL range is more than adequate for all economic cycles.

Financial Reporting Erodes Trust and Transparency

What makes the request even more problematic is NCUA’s use of misleading data to obscure the NCUSIF’s financial condition.  NCUA states that NOL at 2020 yearend was 1.26%.  The actual audited reserves to insured shares ratio was 1.318%.  NCUA’s number fails to include the true-up of the 1% deposit on yearend insured shares–an accounting practice followed until 2001.

NCUA’s conversion to Federal GAAP standards in 2010 further confused the fund’s financial reporting.  The NCUSIF’s “federal” accounting presentation of operating results is today converted by staff into a private GAAP income statement format for public reporting. The “federal” balance sheet includes unrealized investment gains and losses in the Cumulative Results of Operations (aka reserves) and omits all “fiduciary” assets in the AME’s including the billions in the corporate estates.

Federal accounting standards are inappropriate for a cooperative fund owned by credit unions.

The NCUSIF must return to private GAAP accounting principles for transparency, the same practice required for all credit unions.  It is the standard used for NCUA’s other three funds: the Operating Fund, the CLF and Community Development Revolving Loan fund

The 36 years of actual NCUSIF performance shows this cooperative design works in all economic cycles and industry conditions.

Not a Resource Challenge

This ongoing effort to permanently change the fund’s long proven NOL structure inverts the real challenge facing the NCUSIF model; the shortfall is not financial resources, but how the fund’s problems and capital are managed.

The largest natural person losses are not the result of a macro economic cycle.  The losses from the $239 million St Paul Croatian and the $40 million member shortfall in CBS Employees FCU were frauds carried out over many years, or decades.

The NCUSIF $750 million expense to resolve the taxi medallion conservatorships is an example of a fire sale to be rid of problems versus creating more cost-effective resolution options.  Why expense $750 million to end its responsibility for taxi medallion borrowers when its own conservators reported shortfalls of only $250 million in the credit union’s final call reports?

Write Now to Sustain NCUSIF’s Financial Soundness

For four years, NCUA has kept this NOL pantomine alive.  Meantime, the arc of NCUSIF performance continues creating a significant cooperative advantage for the system versus the FDIC’s model.

So far the only posted comment is from Mid Oregon CEO Kevin Cole.  He states the key issue clearly in his close:

For many credit unions, participation in the NCUSIF is the biggest, largely unmanageable risk they face. . .Because this risk is tied to actions of the NCUA Board and ultimately, other credit unions, individual credit unions have limited tools to manage the risk. . 

 The NCUSIF through the actions of the NCUA Board has the authority to assess credit unions’ premiums as needed to restore the fund’s equity ratio as needed. For this reason, it is not necessary or desirable for the NOL to be any higher than it absolutely needs to. Share insurance fund reports indicate that most credit unions are well capitalized and pose little risk to the NCUSIF. The credit unions with higher risk levels to the NCUSIF appear to be properly identified and working towards resolution, as evidenced by the low number of failures that cost the fund.

 For the simple reason that the NCUSIF has the authority and the ability to assess credit unions as needed, and credit unions have the means to pay, it makes no sense for the NCUSIF to hold more equity than legally required, except for identified probable losses. The capital belongs to credit union members and should be allowed to be deployed as those members wish.

Please add your voice to Kevin’s.


The NCUSIF Tool Every Credit Union and NCUA Should Use

The cooperatively created NCUSIF is an insurance resource designed for all economic seasons.  Whether there are clear financial skies, clouds or even once-in-a-hundred years storm (e.g. the COVID economic shutdown in the 2nd quarter 2020) the structure is flexible, transparent and proven.

Most importantly, its current performance is easy to monitor, by anyone.  It does not require a PhD in economics, 20 years of regulatory experience or even the expertise of a Black Rock.

There are only four moving parts.  There are 36 years of actual data to call upon.  Each component has historical and contemporary data to employ in the model.

The model’s four variables are:

  1. The operating expenses taken off the top from NCUSIF income through NCUA’s OTR process;
  2. Insured losses–there is data for all economic cycles. In the past 13 years and two crises, the cumulative rate is loss rate is 1.51 basis point for each $1 of insured savings.
  3. The yield on NCUSIF’s portfolio reflects the staff’s investment decisions, and is semi-fixed in the short term due to its current weighted average life of over three years.
  4. Credit union insured share growth. It is reported quarterly.  The most recent 13 year CAGR is 7% even including 2020’s unusual rate of 22%.

The Model Demonstrates A Better Way

In 1984 credit unions and NCUA worked together to create a cooperative fund that would be A Better Way than the failing premium-based systems. This dynamic model shows how this financial design works and more importantly how it can be even better managed today.

The model has two key capabilities.  It dynamically links the four financial variables so that any input change automatically recomputes all outcomes.

Second it translates the variable input measures into understandable, actionable data.  Converting historical insured loss experience (bps), rates of share growth and investment yields(%), and operating expense ($) into one integrated financial design ensures the model always aligns with the size of insured risk.  For example 1 basis point loss in 2010 is $76 million; however in 2020, that same loss rate is $144.5 million due to the growth of insured shares. The model’s output is provided in all three measures: $, % yields, and basis points to easily understand the options for the yearend NOL.

Events have demonstrated that NCUA’s NCUSIF models used in 2017 through today are not based on any objective reality.  The so called scenarios are financial myths developed to support NCUA’s desire to remove the guardrails on the most successful deposit fund ever managed by the federal government.

The Dynamic Spread Sheet

This is the link to view the xcel calculator with the numbers used below.  To enter your own numbers, feel free to make a copy (open this view-only copy with google sheets, click File, then Make a Copy).  Using your copy will automatically calculate the yearend outcome with your inputs.

Models are not answer machines. They inform judgments.  They require objective validation.  When used properly, they identify options and improve management effectiveness. The following is the example shown in the “view-only” model link above.

An Example With Actual Data

The audited yearend NCUSIF data from December 31, 2020 is entered in the view-only example. This includes the audited reserves ($4.7 Bn), insured shares ($1.467 Tr), the reserve ratio (.318) and a 2021 yearend goal for this ratio (.30).  With the 1% credit union deposit, the spread sheet calculates the performance required to reach a 1.3 NOL at 2021 yearend.

The columns E, F, G and H are four variables that can be updated anytime.  I have entered both current numbers and informed estimates.  For share growth I used the first quarter’s annual rate of 23%; for loan loss I entered .5 of a basis point which is below the long term 1.51 rate because to date, the NCUSIF has reported net recoveries.

For total investments I have added the increase in 1% deposits from the year end true up and a mid-year estimate.  However, the portfolio’s size is not increased 100%, reflecting that these additional deposits will only earn for 9 and 3 months, respectively.  The $190 million expense total is higher than 2020’s expense and uses the 2021 budget modified by actual results through May.  Finally, for the yield, I entered NCUSIF’s current year-to-date portfolio return, 1.27%.

The five green columns show the projected yearend outcome from these inputs.  The required portfolio yield is 5.28%, way above the current yield.  This shows a yearend NOL of 1.257.  To raise that outcome to the target 1.30 level would require a maximum premium of 4.33 basis points of 2021 yearend insured shares or $782 million—if nothing changes in these input assumptions.

That certainly seems a dour result in this relatively stable and growing economic climate.  It does not necessarily require a premium. At numerous points in the past when the NOL ended below the 1.3% cap, NCUA has foregone a premium at yearend, most recently in 2016 ending  with a 1.24 NOL.

A Different, More Probable 2021 Scenario

However, this forecast and assumptions are an unlikely outcome. Extraordinary share growth is driving this result.  The rate is already slowing.  June and September call reports will provide a more relevant number.

For example, if insured shares grow at the 13-year average of 7%, then the results are totally different.  The required portfolio yield would be just 1.6%, and the year-end NOL, without any premium, is 1.296, almost at the 1.30 cap.   Further, if there were no insurance losses (zero loss provision), and only continued recoveries, the yearend ratio would be 1.308, above the NOL target.

It’s Not Rocket Science

Credit union CEO’s and boards are living daily the operational experiences underlying these inputs.  They know industry growth trends, delinquencies and certainly have a feel for interest rates.  Their input assumptions can be informed by their real world understanding, not guesses about the future.

This simple model should empower every credit union to evaluate the information and NCUSIF projections used by NCUA. Responses should be formed from their expertise and data, not unsupported opinion.

But more importantly, anyone who uses it will understand the flexibility and viability of the NCUSIF’s cooperative design.

Every year the NCUSIF automatically grows at 80% of the share growth rate via the 1% deposit true-up (1/1.25).

If insurance losses, share growth or yields fall outside the long-term credit union system’s experience, then a premium is an option to maintain a targeted reserve ranging from .2 to .3.  There were many adjustments to the NCUSIF equity during the 2008-2020 period.  However, the two premiums in 2009 and 2010 averaged only 1.3 bps annually over these 13 years.

The Yield Calculator as a Management Tool

Another value of the NCUSIF model is using the Yield Calculator and the recent 13-year averages to calculate the breakeven yield on investments needed to maintain an NOL target, say 1.25, or within a narrow range.  One must first convert the operating variables to basis points. Adding the 7% insured share growth rate(1.75 basis points) plus 1.51 basis point loss experience, and the 1.6 bps of operating expenses totals 4.86 basis points.  Dividing this total by the portfolio size of 1.25  (the midpoint of the  NOL)  shows the “breakeven” investment yield needed to support this NOL is 3.9%.

The model clearly highlights the relative importance of each of the four variables.

Operating expenses come off the top of revenue. If the OTR had remained aligned with the proportion of state charters, or 50%, the operating expense share would have been 1.41 (not 1.6) basis points, thus lowering the required breakeven yield.

If share growth were 22%, not the long-term average of 7%, the bps for this variable would increase to 5.5 and the required yield jumps to 6.9%.

 Managing the NCUSIF’s Portfolio

The model demonstrates the importance of monitoring the decisions about NCUSIF’s investment  portfolio. If the current yield 1.27% and 4.86 basis point of inputs were frozen forever, credit unions might have to pay an annual premium of 3 basis points (1.27%-3.9% equals yield shortfall of 2.63%/.8/1.07 = bps premium on the new year end 1% insured share base) to maintain the NOL at a 1.25 breakeven level.

Informed oversight of the NCUSIF’s portfolio decisions is a vital responsibility of NCUA  management and board.  Market rates change. In the interest rate trough of this economic cycle, should NCUA be making 8-year fixed term investments for a 1.26% yield (April 2021) when knowing the breakeven goal for NCUSIF is  3% to 4%?

On November 18, 2018, the yield on the two-year treasury bill was 2.98%.  Today the yield is .26%.  If NCUA’s investment managers are supporting the NCUSIF’s financial model, should they be routinely  filling out an investment ladder up to 8 years in this part of the economic cycle? Common sense says no—this will reduce NCUSIF’s income, shortchanging credit unions years into the future.

The economy is at an historical low point in this interest rate cycle.  The dominant economic topic today is the inflation outlook.  Are price increases here to stay or a transitory event?  Whatever the outcome, realistic judgment suggests that rates will be higher 6-12 months from now–the only question is how much higher. An example of this change prospect  from the past ten years is that the peak in the 5-year treasury yield was 3.07% on October 1, 2018, just two and a half years ago.

Tools Are Only as Good as the User’s Skills

Every credit union uses spread sheets.  This model is a simple, automatic xcel tool-just add your own judgment.  All the variables are in the formulas.  Some inputs are set; others easy to project.

Interpreting the outcome(s) is the art.   Bias will sometimes cloud these judgments. That is why it is vital that commentators on NCUA’s request for NOL comments document opinions with factual underpinnings and an understanding of how special this coop fund is.

Good luck with the model; critiques/questions are welcome.  Tomorrow I will suggest points to make by credit unions responding to this NCUA’s NOL request.

Facts vs. Fictions: the NCUSIF Financial Model Works—Even When Mismanaged

This is the third of five articles looking at how the NCUSIF financial model has performed during the past 13 years, even the times when it has been mismanaged.

NCUA’s request for comments on NCUSIF’s NOL assumes the core model of a .2 to .3% level of retained earnings on top of the 1% credit union underwriting is inadequate. Chairman Harper openly states this view. The facts going back to 1984, or 36 years of operation, show otherwise.

From 1984 through 2007, the NCUSIF’s financial model delivered the results promised. Losses were minimal, there were dividends in a number of years; premiums assessed only twice; and the NOL easily maintained in the .2 to .3 range.

So successful was the model that the fund paid six consecutive dividends from 1995 to 2000 and again in 2006 and 2008. It would have distributed more except NCUA changed the way it calculated the NOL by excluding the required yearend true-up of the 1% deposit beginning in 2001.

The following graphs are based on NCUSIF’s audited statements for the years 2008 though 2020. This 13-year span is used because it includes the two great post-Depression systemic financial crises and years of historically low interest rates to prod recovery. Here is what the data shows.

Coverage for Insured Loss Risk

Throughout this period, the cumulative actual losses were 1.51 basis points of insured shares. In five of these years, losses were less than 1 basis point. In 2020 cash recoveries exceeded losses.

During the 2008-2010 Great Recession actual losses never exceeded 3.5 basis points. The peak year in losses was 2018 at 7 basis points, when NCUA liquidated the taxi medallion conserved credit unions.

The year-by-year actual loss and the cumulative long term loss experience of 1.51 basis points are shown below. The normal NOL range of 10 basis points is almost 7 times greater than this historical average.

However, NCUA’s accounting estimates for loss provision expense, on a year-in year-out basis, have no correlation to actual events. This provision expense is shown in annual reports as “insured losses” and creates a very misleading presentation.

The graph below shows that the provision account has been at times funded at a level 10 times (1000%) greater than the following year’s actual losses. In credit unions, the allowance account ranges between 1 and 1.5 times actual losses.

The result of this misleading loss provisioning results in dramatic swings, from an expense of $737 million in 2010, to a reversal of $526 million in 2011, a total of income statement impact of $1.3 billion in just two years.

The graph below shows how these mistaken estimates create wide variance in reported net income versus the actual insured losses. These exaggerated loss provisions were the basis for assessing unnecessary premiums rather than informed judgments based on historical loss experience and a common sense view of current events.

NCUSIF Operating Expenses Exceed Insurance losses

Over the past 13 years, NCUA has charged the NCUSIF $2.2 billion in expenses, an amount $270 million greater than all insured losses of $1.9 billion for the same period.

The result is that NCUSIF has become the primary funder of NCUA’s operations, rather than the operating fee intended for this purpose.

The graph below shows that in eight of the past 13 years, operating expenses have been greater than insured losses:

This outcome is because over 93% of NCUSIF’s operating expenses are from the Overhead Transfer Rate (OTR). This transfer charge has ranged from a low of 52% (2008) to as high as 73.1% (2016) of the agency’s total yearly spending.

The combination of these arbitrary changes in the OTR (State chartered federally insured credit unions have never exceeded 50% of the insured base) and wildly inaccurate loss provisions, illustrate the difficulty of relying on NCUA’s financial reports to assess the sufficiency of the NCUSIF model.

In fact, a reasonable interpretation is that the model has functioned well despite significant missteps by NCUA.

NCUSIF’s Total Yearend Reserves are Much Higher than the Reported NOL

Since 2001, NCUA has not included the yearend true-up of the 1% required credit union deposits when calculating the NOL. The result is to understate the actual NOL. It is easy to calculate the actual reserves above the 1% deposit contributions by dividing the reserves by insured shares.

When this is done as shown on the chart below, the actual NOL is always greater than the number NCUA reported. In some years the difference is over 5 basis points.

For example, in 2020 NCUA reported the NOL was 1.26% whereas the actual number was 1.32%. Each basis point of 2020 insured shares is $144 million. This belated true-up practice substantially misrepresents the NCUSIF’s actual financial condition.

Moreover, by adding the allowance for loss (already expensed) to the retained earnings, the actual dollars and margin in bps for covering losses is greater than the just ending NOL. As shown below, the reserves plus allowance account have exceeded .3% level (or legal cap for a premium) for the NCUSIF every year since 2008. In 2017 this total reached a peak of 55 bps or 25 bps higher than 1.3%.

Federal GAAP Accounting Further Confuses NCUSIF’s Presentation

The NCUA board’s adoption of Federal GAAP standards for NCUSIF reporting in 2010 created two additional transparency problems.

Federal GAAP does not report retained earnings/reserve in the same manner as private GAAP. The reserves called Cumulative Results of Operations include any change in unrealized losses or gains on the fund’s investment portfolio, its largest asset.

The graph below shows how this “valuation” over-or-understates actual reserves by as much as $466 million (2020). NCUA does not use this valuation when it calculates the NOL, but it is the amount shown in NCUSIF’s “net position” in the balance sheet prepared using Federal GAAP.

A second point of confusion is adjustments to prior periods of loss estimates for NCUA’s liquidation estates. As fiduciary assets, these amounts are not included on the “government entity’s” (NCUA’s) balance sheet. Only the net change in receivables is shown.

The chart below shows these prior adjustments to loss estimates total $313 million and are increasing in amounts. These managed assets should be audited, as in private GAAP and not excluded, so these valuations are subject to independent review.

The Resilience of the NCUSIF Model

The data show the NCUSIF financial model is resilient. The combined total of insured losses (1.51) and operating expenses (1.77) are well within the 10 basis point traditional NOL range. This is true even in this 13-year period which includes two major economic crises. This is the actual outcome, not estimates, forecasts or misleading modeling outputs.

To pay this combined expense of 3.28 basis points requires a 2.5 % investment yield (3.28/130) on the portfolio. If insured losses are 0, then the yield for operating expenses alone is only 1.36%. A portfolio yield range of 1.36% to 2.5%, on average, is sufficient to provide revenue for these two costs.

Incorporating Share Growth in a Dynamic Model

However additional income is necessary to maintain the NOL level in line with insured share growth. Tomorrow I will attach a dynamic spread sheet that shows how to easily calculate this required yield incorporating all four variables. Anyone can update and project their forecast for yearend NOL. As a preview, the 13-year insured share growth is 6.9%. Therefore the .30 in reserves would have to grow by this rate to maintain the ratio’s current level, which would require 1.6% additional yield. (2.1/130).

If the retained earnings fall below the traditional 1.3% NOL, then the board can assess an annual premium to this cap if needed. Historically, the board has rarely used the premium just to raise the fund’s balance to the maximum 1.3% cap. Rather, it has left the NOL in a range of 1.25 to 1.29 or wherever the financial results ended.

NCUA’s Calculations Raising the NOL are Suspect

When merging the TCCUSF into the NCSIF in 2017 and again in the December 2020 Board meeting, staff recommended keeping the NOL above the historically proven 1.3% cap. The board did not have this authority until CUMAA passed in 1998 which raised the maximum cap to 1.5%.

During the 2008/09Great Recession and afterwards, the board retained the 1.3% cap. The most accurate statement in the 2017 staff presentation for raising this cap was in the concluding slide: “Actual results may vary from projections.” These same models were again used in the December 2020 board NOL update even though wildly inaccurate compared with actual experience.

The 2017 NCUSIF projections were not due to any fundamental change in the NCUSIF’s financial capabilities or the economic outlook. Rather it was an opportunistic effort to retain as much as possible of the TCCUSF surplus upon merger. These funds above 1.3% would then facilitate the liquidations of two taxi medallions in conservatorship without assessing a premium. Board member Rick Metsger and Chairman Mark McWatters confirmed this in public comments.

NCUA staff continues to use this strained, artificial logic from the TCCUSF merger to keep the NOL above 1.3. Lifting the NOL cap in 2017 was opposed by credit unions unanimously in their comments. But NCUA changed not a single number in their plan. Credit unions were also clear that NCUA should go back to the 1.3% cap as soon as possible if the Board approved 1.39 as the new NOL cap.

In December 2020, staff recommended a 1.38 NOL cap with the same hoary reasoning. They projected a 16 basis point decline of equity in a moderate recession and another 2 basis points from lower corporate recoveries, adding 18 basis points to the 1.2% lower NOL limit.

As in 2017, these modeled numbers are not based on any verifiable data. Why a lower than expected recovery on corporate AME claims reduces NOL is not explained. Projecting a decline in NOL to justify raising the NOL is circular logic.

The staff’s model includes no recognition that the largest expense to the NCUSIF is NCUA’s OTR operating costs. Staff did not use this expense factor when justifying the 16 basis points needed to “prefund” NCUSF equity for a moderate recession.

The NCUSIF is already funded by the ongoing 1% credit union contributed capital.

Dystopian Future Forecasts

NCUA’s models are fictions. Assumptions are not back tested against real world results.

Dressed in real numbers, projections are presented as “future facts” (scenarios), which are unknowable. However these financial myths have immediate consequences for credit unions. The Board bases present day decisions such as OTR expense transfers, premium assessments, capital spending or dividends on these hypothetical multi-year forecasts. Credit unions then pay the price now for incorrect projections which will only be revealed in the future.

NCUA’s dystopian forecasting was responsible for the corporate catastrophe. It led to an incorrect understanding of reserves, underestimated future earnings from investments, and ignored the improving current trends in market valuations.

For natural person credit unions, the most dramatic example of mistaken forecasts is NCUA’s $1.4 billion loss provisions in 2009 and 2010. Actual cash losses for those two years were $373 million. The difference of over $1 billion came out of credit union pockets via premiums.

The year of the worst GDP quarterly fall in American economic history was 2020. Yet, the NCUSIF reported positive cash recoveries, not insured losses. This short lived recession did not impact on equity as projected in 2017. Yet staff still asserted the need for a 16 basis points margin even as the 13-year cumulative insured loss experience declined further to 1.5 basis points.

The dominant issue for credit unions when commenting on NCUA’s NOL request is straight forward. The data show the challenge is not adding additional resources, but rather managing more effectively and transparently those already in place or on call

Tomorrow I will link to a simple spread sheet anyone can use to project outcomes for the NCUSIF. The assumptions entered and data are clear. Forecasts can be updated with real data at any time. The prospect for a premium or dividend is easily seen. A breakeven yield to achieve an NOL target is instantly calculated.

NCUA’s NCUSIF Accounting Short-Changes Credit Unions

This is second of five articles is to assist credit unions responding to NCUA on the capital adequacy (NOL) of the NCUSIF due July 26.  The first article quoted Chairman Todd Harper’s unsubstantiated view that  NCUSIF’s structure is inadequate and requires more NCUA authority to assess premiums.

This article reviews the accounting changes, beginning in 2001, that reduced NCUSIF dividends and increased expenses. These changes have prompted some to suggest that NCUSIF’s financial design is inadequate — a mistaken judgment I will challenge.

NCUA published NCUSIF’s audited financial statements for 2008 and 2009 only after a prolonged delay. With these audits NCUA changed accounting standards creating  confusion, misleading presentations and uncertainty about what assets were audited.

The NCUSIF is unique due to its cooperatively underwritten financial structure.  To provide relevant responses to NCUA’s request requires agreement on basic facts.  NCUA’s changes  in 2000  deviated from the NCUSIF’s prior consistent accounting practices used since the 1984 redesign was approved by Congress.

These changes resulted an ever increasing draw on the NCUSIF to pay a larger proportion of NCUA’s operating expenses and underpaying dividends to the credit union owners.

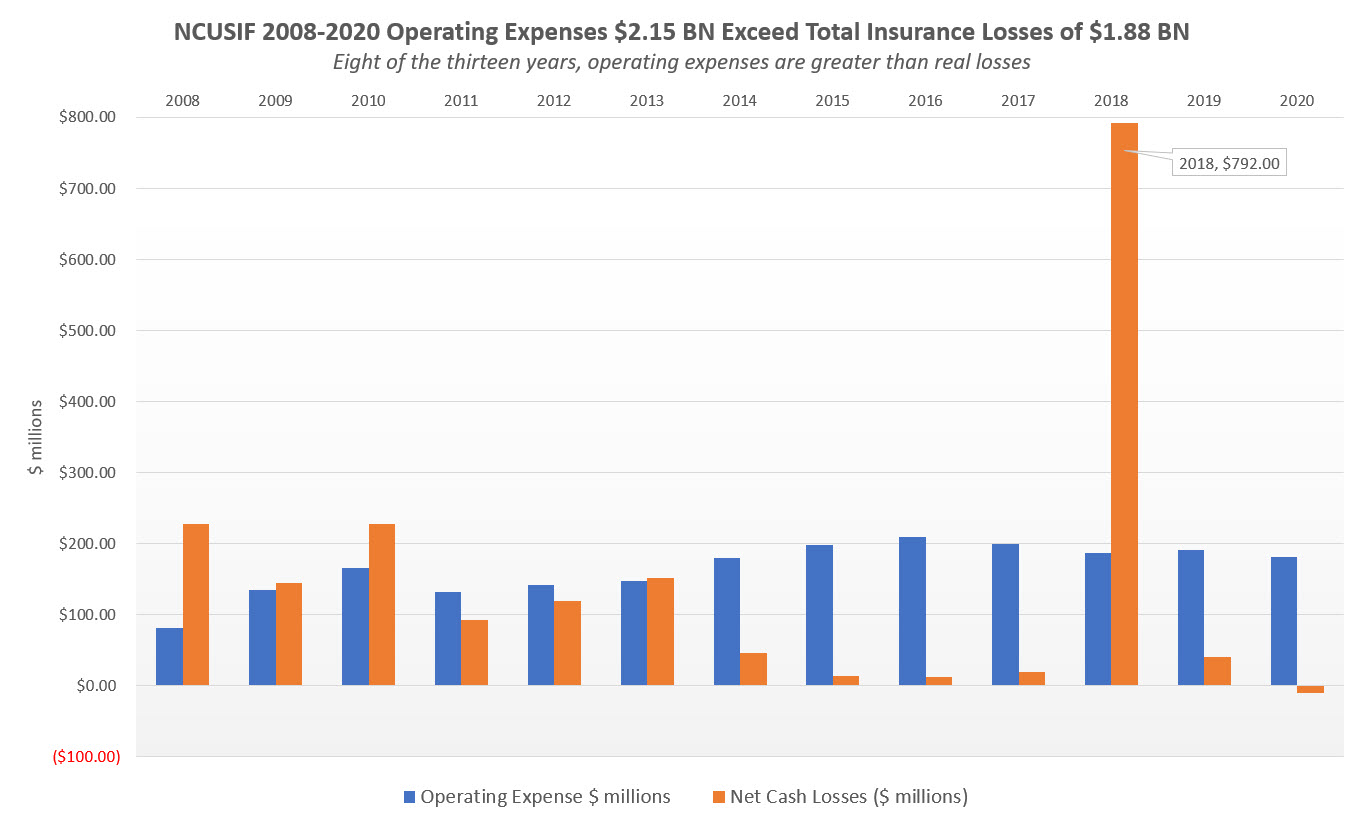
Since 2008  and two financial crises, the data show that  the NCUSIF’s  operating expenses exceed  insurance losses from problem credit unions. Instead of a capital reserve helping credit unions, the NCUSIF has become the main source for financing the agency’s administration, not the required operating fee.

The following is a description of these significant changes in NCUA’s management of the NCUSIF.

Manipulation of the NOL

From 1984 though 2000, NCUA was consistent in its calculations of the NOL. Credit unions’ 1% deposit funding obligation has always been an explicit legal liability. As stated in the Act: Federally insured credit unions are required to maintain a deposit equal to one percent of their insured shares with the Insurance Fund. 12 U.S.C. 1782(c)(1)(A)(i).

In the NCUSIF’s 2000 Annual Audit, this 1% capitalization and NOL calculation are reported as follows in audit footnote 5.

“The Credit Union Membership Access Act (CUMAA) of 1998 mandated changes to the Fund’s capitalization provisions effective January 1, 2000. . . The NCUA board has determined the normal operating level to be 1.33% as of December 31, 2000 which considers an estimated $31.9 million in deposit adjustments to be billed to insured credit unions in 2001 based upon insured shares as of December 31, 2000. . . The CUMMA mandates that the use of year-end reports of insured shares in the calculation of the specified ratios, and the dividends related to 2000 will be declared and paid in 2001 based on insured shares as of December 31, 2000.”

This 1.33% ratio was calculated by dividing NCUSIF’s audited reserves plus 1% of yearend insured shares by total insured shares. This method was the basis for sending credit unions a sixth consecutive dividend from 1995 through 2000.

But in 2001, the Board changed this calculation both retroactively for 2000 and going forward in 2001 and ever after. This change is described in footnote 5 in the 2001 audit:

“The NCUA Board has determined that the normal operation level is 1.30% as of December 31, 2001 and December 31, 2000. The calculated equity ratio at December 31, 2001 was 1.25%. The equity ratio at December 31, 2000 was 1.33% which considered an estimated $31.9 million in deposit adjustments billed to insured credit unions in 2001 based upon total insured shares as of December 31, 2000. Subsequently such deposit adjustments were excluded and the calculated equity ratio at December 31, 2000 was revised to 1.30%.

However, NCUA did pay the previously calculated dividend for 2000 based on the initial 1.33% NOL. “Dividends of $99.5 million which were associated with insured shares of December 31, 2000 were declared and paid in 2001.”

If the same method of calculating equity to insured shares ratio in 2000 were applied in 2001, the resulting NOL would be 1.303%– not 1.25%– thus triggering a small dividend.

By undercounting the full 1% deposit NCUA avoided paying  a dividend. It misstated the actual NOL of 1.3% by 5 basis points, a significant reduction.

There was no basis for this change. In every year prior to 2001 NCUA sent invoices after yearend. That is the case today as NCUA bills credit unions their required true-up on insured savings after receiving the yearend call reports.   The  yearend NOL determination is easy and transparent– both the audited reserves and credit unions’ report of insured shares are available at the same time from the same source.

In making this arbitrary change to the NOL calculation, NCUA has understated the actual NOL to the present day. The underreporting of this ratio meant NCUA did not pay dividends as required (as in 2001) and understated the actual NOL ratio.

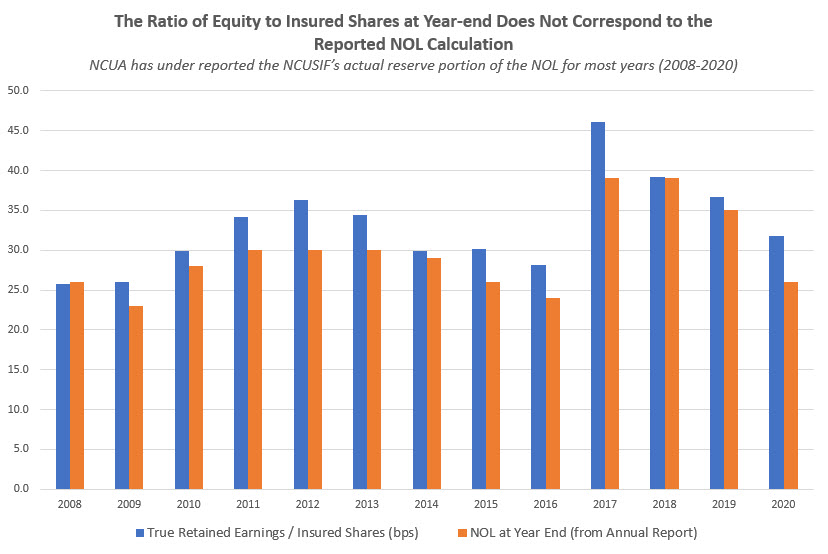
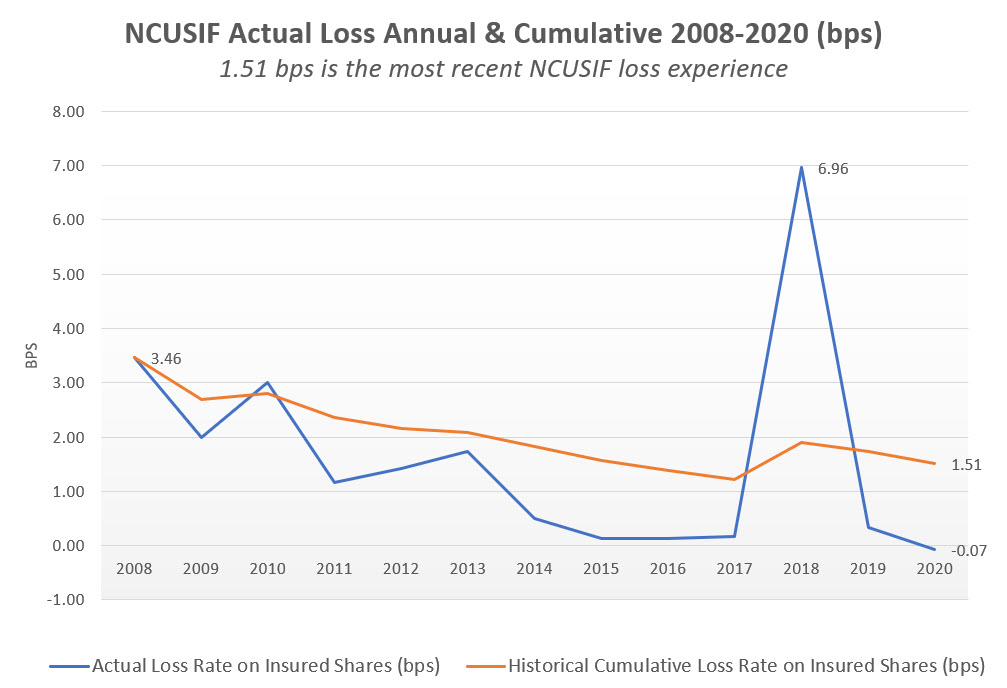
Graph Heading;  NCUA’s Reported NOL Understates NCUSIF’s Actual Capital Ratio (2008-2020)

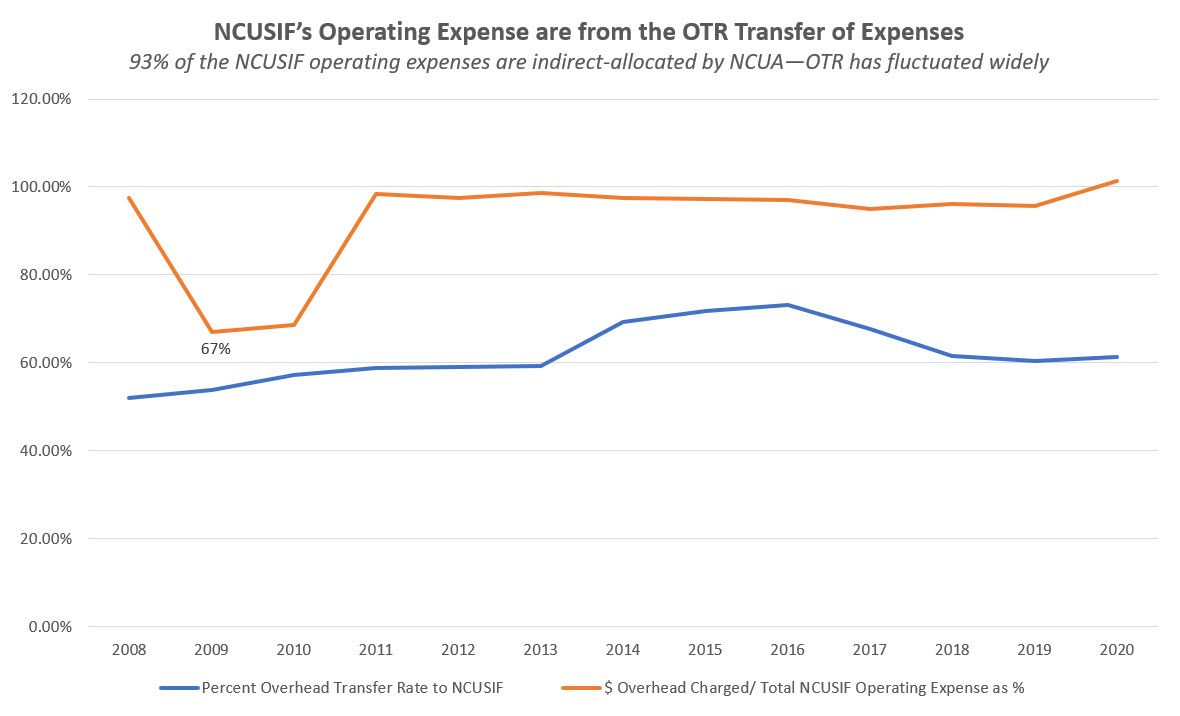
Changing the OTR in 2000

Another NCUA draw upon the fund began at this time. In 2000 NCUA increased the percentage of its operating expenses charged to the fund via the Overhead Transfer Rate (OTR). The change from 50% to 66.7% was a 33% increase in just one year. This increase occurred  even though state chartered federally insured credit unions (FISCU’s) were only 44% of the total 10,316 of the NCUSIF’s insured base.

The agency continued to use this annual transfer in uneven and undocumented patterns reaching a peak OTR of 73.1% in 2016. This  increase reimbursement for agency expenses and understating the actual NOL resulted in no or only partial dividends due the credit union owners.  This dividend drop-off took place even though insured losses from 2001 until 2008 were either 0 or less than 1/2 of a basis point.

For example, in the 2006 audit, the NCUSIF declared an NOL of 1.304 requiring a dividend of $51.5 million. The actual ratio was 8 basis points higher and should have resulted in $103 million more paid out but which was kept in the NCUSIF.

No Timely Numbers and Changing Auditors

In the midst of the 2009 financial crisis, NCUA conserved US Central and WesCorp. Chairman Michael Fryzel asserted in a March 21, 2009 Wall Street Journal interview, “With us in control, we’d get honest numbers.”

That is exactly the opposite of how NCUA reported its own numbers for the NCUSIF. All the corporates routinely filed and published full 5310 monthly financial reports with current portfolio valuations within 30 days of every month end.  The corporates were managing over $100 billion in investments. But  NCUA did not release its December 2008 NCUSIF audit until a year and a half after yearend.

During this period of  uncertainty, NCUA took the following steps:

  • It replaced the NCUSIF’s 2008 auditor Deloitte, Touche with KPMG for 2009;
  • It changed auditing standards–from private GAAP to government GAAP;
  • It released the December 2008 audit on June 10, 2010, 15 months after the statutory April 1 deadline for reporting to Congress.

These actions typify a reporting entity with serious managerial difficulties subsequently noted by both auditors.

By delaying the release of the numbers, credit unions did not know the status of the fund. NCUA statements ranged from Chairman Fryzel’s assurance in the WS J that “regulators aren’t concerned about the health of any other wholesale credit unions besides the two brought into conservatorship” to wild exaggerations of losses that would cause write off of credit unions’ 1% deposit base.

The corporates managing the problem assets reported timely; NCUA did not.

NCUA provided few factual updates to counter the rampant hyperbole. Meanwhile the economy showed positive growth in GDP and market valuation recovery beginning in the fourth quarter of 2009.

Without NCUA’s numbers, credit unions were in the dark about how a mutual solution might be developed to minimize loss using the collaborative financial tools of the CLF and NCUSIF.

Late Reporting and Changing the NCUSIF’s Accounting Standard

Until 2009, “the NCUSIF historically prepared its financial statements in accordance with accounting principles generally accepted in the United States of America (“GAAP”), based on standards issued by the Financial Accounting Standards Board (“FASB”), the private sector standards setting body.”

The issue following this standard was whether US Central and or Wescorp, conserved in March,  must be consolidated with the NCUSIF under the Variable Interest Entity (VIE) rule. As a subsequent event and prior to the completion of the December 2008 audit, the VIE presentation needed to be resolved. As stated in their audit, this situation was one indication that NCUA did not fully grasp the consequences of their actions.

The resolution of this was described in the audit notes for 2008:

It was concluded that for 2008 the NCUSIF would be the primary beneficiary of certain identified VIEs based on variable interests held by the NCUSIF at December 31, 2008, and therefore, the NCUSIF would have been required to consolidate such VIEs in its financial statements for the year ended December 31, 2008. However, based on the actions discussed below, it was concluded that the TCCUSF would be the primary beneficiary of these same VIEs based on variable interests held by the TCCUSF at December 31, 2009.

The shift in primary beneficiary from 2008 to 2009 was the result of the June 18, 2009, actions of the NCUA Board to transfer the legal obligations related to CCUs from the NCUSIF to the TCCUSF. Such actions relieved the NCUSIF for the costs and related obligations of stabilizing the CCU system, as provided by Public Law 111-22, which was enacted May 20, 2009.

This change in reporting entity has been applied retrospectively to 2008. Accordingly, the accompanying financial statements for the year ended December 31, 2008 do not reflect the consolidation of any CCUs.

Avoiding Private Auditing Standard Requirements

To avoid VIE accounting requirements, NCUA in its September 16, 2010 public board meeting adopted federal GAAP.  These are excerpts of this discussion:

Mary Ann Woodson, the agency’s CFO at the time: The purpose of this action is to request Board approval for the National Credit Union Share Insurance Fund to adopt accounting standards promulgated by the Federal Accounting Standards Advisory Board, also known as FASAB. These standards are also commonly referred to as Federal GAAP.

The Share Insurance Fund currently applies Financial Accounting Standards Board, or FASB, standards. These accounting standards are used by commercial businesses in keeping their books and records and in preparing their financial statements.

On June 17, 2010, the NCUA Board adopted FASAB accounting standards for the Temporary Corporate Credit Union Stabilization Fund. Since then, we have gained more experience with FASAB and we have seen firsthand that FASAB standards more appropriately meet the financial reporting requirements of the NCUSIF and its stakeholders. Also, FASAB is the preferred standard for federal entities. . .

Debbie Matz, then NCUA Chair: So, if we had switched to this before last year, we wouldn’t have had the long drawn-out issue with the auditors that required us to meet with FASB in order to get a clean audit opinion at the end of last year, but it would have eliminated the inconsistencies and vagaries that created that situation?

Mary Ann Woodson: Certainly it would have helped. Yes.

Debbie Matz: Well, then I support it. Thank you.

Both auditing firms commented that NCUA did not understand or follow basic auditing procedures whichever standard was in place:

The 2008 and 2009 NCUSIF audits  released on June 10 and 11, 2010 included auditor’s comments on accounting deficiencies. The 2008 Deloitte audit reported “material weakness” in NCUA’s failure to “properly identify the appropriate accounting treatment under Financial Accounting Standards Board (FASB) Consolidation of Variable Interest Entities with respect to its variable interests in certain corporate credit unions.”

KPMG’s 2009 audit reported a “significant deficiency.”  The SIF, the report states, “does not have sufficient staff resources with the experience in technical accounting and reporting requirements that the entity requires to consistently perform certain internal control activities, particularly those related to the preparation and review of the financial statements. . . The SIF does not have procedures in place that require review and approval of the journal entries and related supporting documentation.”

Adopting a Misleading Accounting Standard

In this 2010 board meeting NCUA  adopted federal GAAP as the “preferred standard for federal entities.” But it did so only for the NCUSIF in order to avoid certain disclosures according to Matz’s question. However the Operating Fund and CLF continued and are still audited using FASB GAAP.

The problems adopting Federal GAAP are much greater than VIE disclosures. First the NCUSIF is not a federal entity, but rather a cooperatively funded capital reserve for the credit union system. There are no federal appropriations or funds involved.

Investments are in Treasury securities, but that does not make the NCUSIF a government entity any more than it would a credit union holding the same investments. The NCUSIF is totally privately funded and only for credit union system use.

The Federal GAAP income statements and balance sheets are confusing and misleading for credit unions. As explained by Woodson, the agency’s then CFO: “Under FASB, or commercial GAAP, the focus is on netting revenue against expenses for either a net income or a net loss. Under FASAB, or Federal GAAP, the focus is on the cost to government. So we start with the costs and reduce that amount by any revenue earned, to get to the total cost of operations, or said another way, the net cost to the government.”

Under FASAB the focus is on separating transactions within the government from those with the public.  But all NCUSIF transactions are with credit unions, that is, the public.

The FASAB balance sheet presentation and income are prepared to show these two activities, but are totally irrelevant to how the NCUSIF operates. The numbers presented in this manner are at best confusing and at worst, misleading.

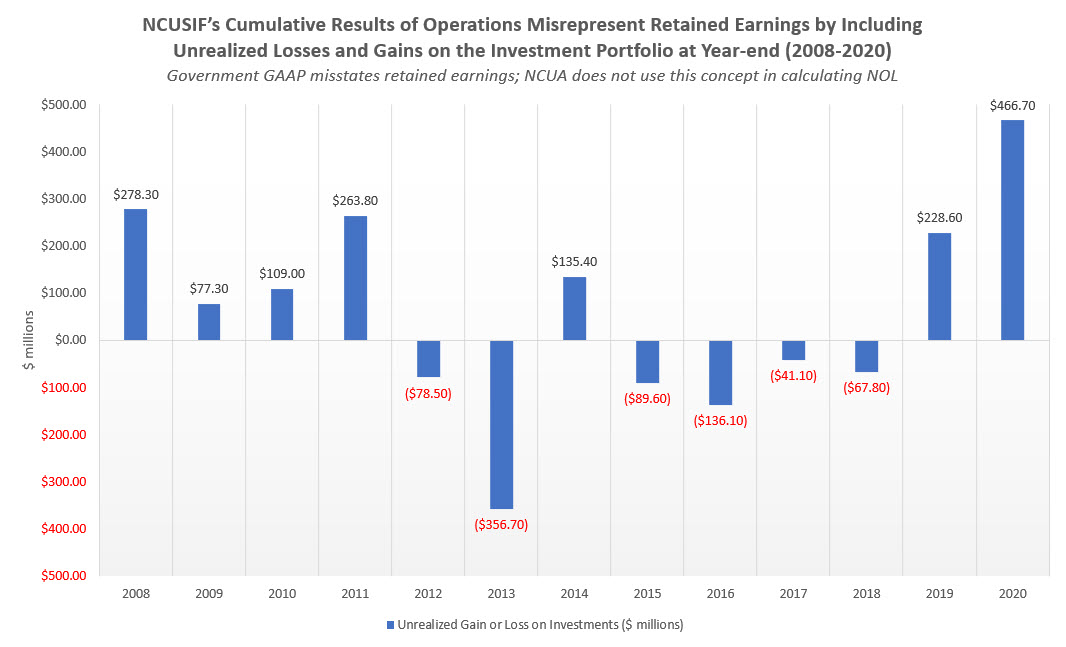
For example, under Federal GAAP the fund’s retained earnings are described as the Cumulative Result of Operations. This description includes unrealized gains and losses on the NCUSIF investment portfolio which can  over or understate actual equity significantly.

In the NCUSIF fiscal 2020 results using Federal accounting, it reported a $500 million increase in its net position to a total of $5.1 billion. However, the actual net income from operations was only $32.9 million. This  number is nowhere in the Federal GAAP statements-but reported on Slide 3 in the NCUA’s staff December 31 presentation to the board using private GAAP. This substantial  difference in the increase in total equity of $400 million versus operating income of $33 million is due primarily to including additional  unrealized gains in NCUSIF investments from the prior year.

NCUA staff reports the total of the federal Cumulative Result in its slides.  But when calculating the NOL, staff eliminates any unrealized gains or losses  highlighting the confusion between the two standards when presenting financial performance.

The difference in NCUSIF’s actual retained earnings and “cumulative results of operations,” varies by hundreds of millions each year (2008-2020) as shown below.

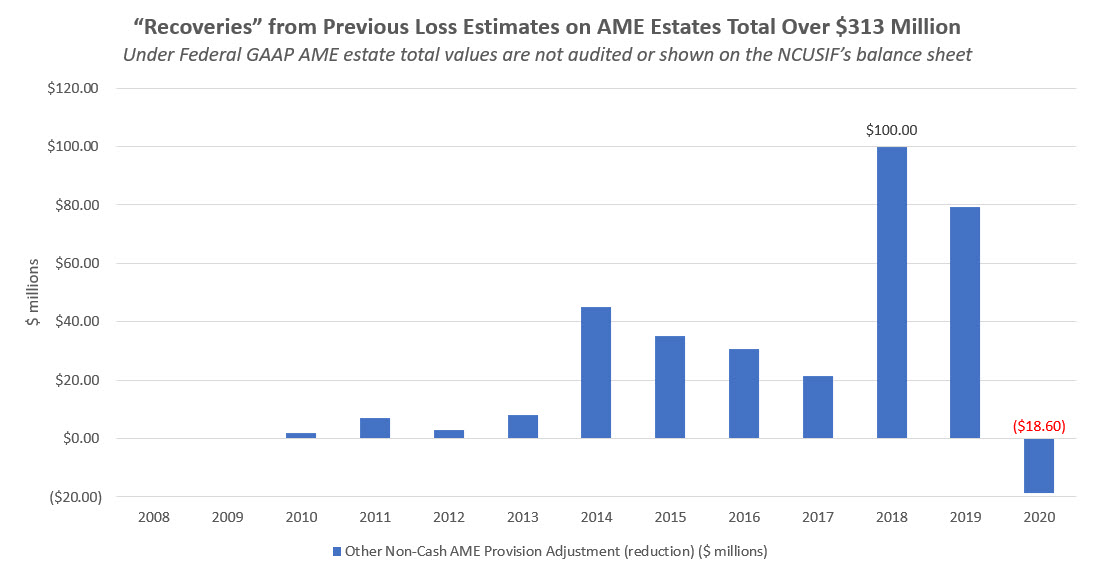
However the most serious defect in federal GAAP is that  “fiduciary assets” are non-governmental and therefore not  on the NCUSIF’s balance sheet.  These are all of the AME’s  including the corporate estates which total  billions.  They are in effect off the books.

As stated at the top of the AME financials issued by NCUA, the amounts are unaudited.  Under private GAAP these amounts would be audited and included  on the NCUSIF’s balance sheet.  Currently the amounts for corporate and natural person AME’s are presented  in Federal GAAP as “net”  receivable assets subject to various accounting and income recognition rules.

Using the Proper Accounting Standard in a Consistent, Transparent Manner is Critical

To evaluate the NCUSIF’s financial design and capital adequacy, an essential first step is adopting private FASB accounting. This is how NCUA staff routinely presents the board with NCUSIF slide updates—except for the balance sheet entry showing “cumulative results of operations.”

Returning to this accounting standard will help all users more easily understand when monitoring the fund. It will:

  • Present financial performance in a standard balance sheet and income statement format readily understood and monitored by credit unions;
  • Restore the NOL calculation as was done from 1984 through 2000. The misleading recognition of the 1% deposit, citing a billing delay, is inconsistent with credit unions’ standing legal liability and misstates the fund’s actual NOL status at yearend.
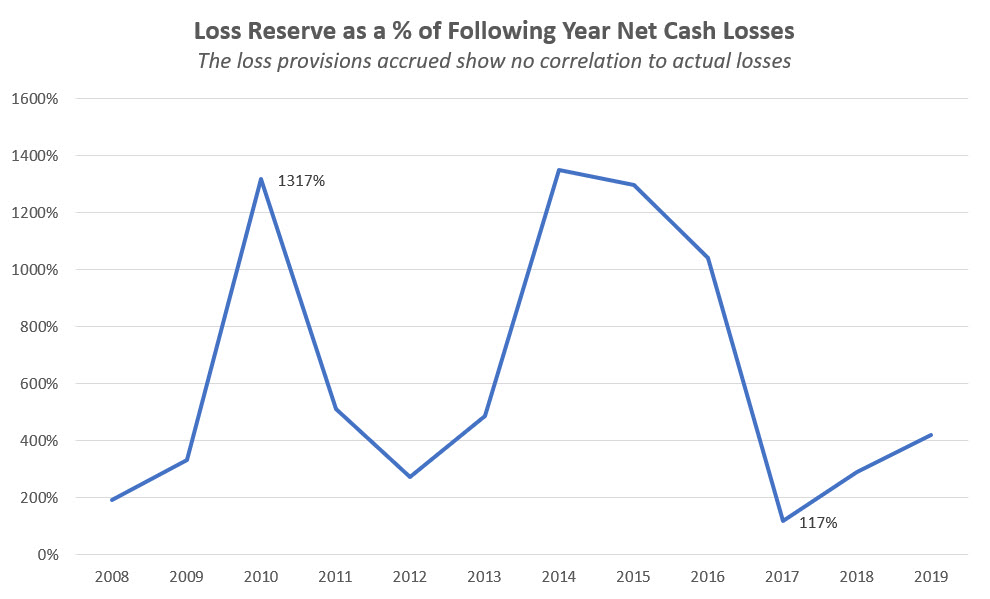
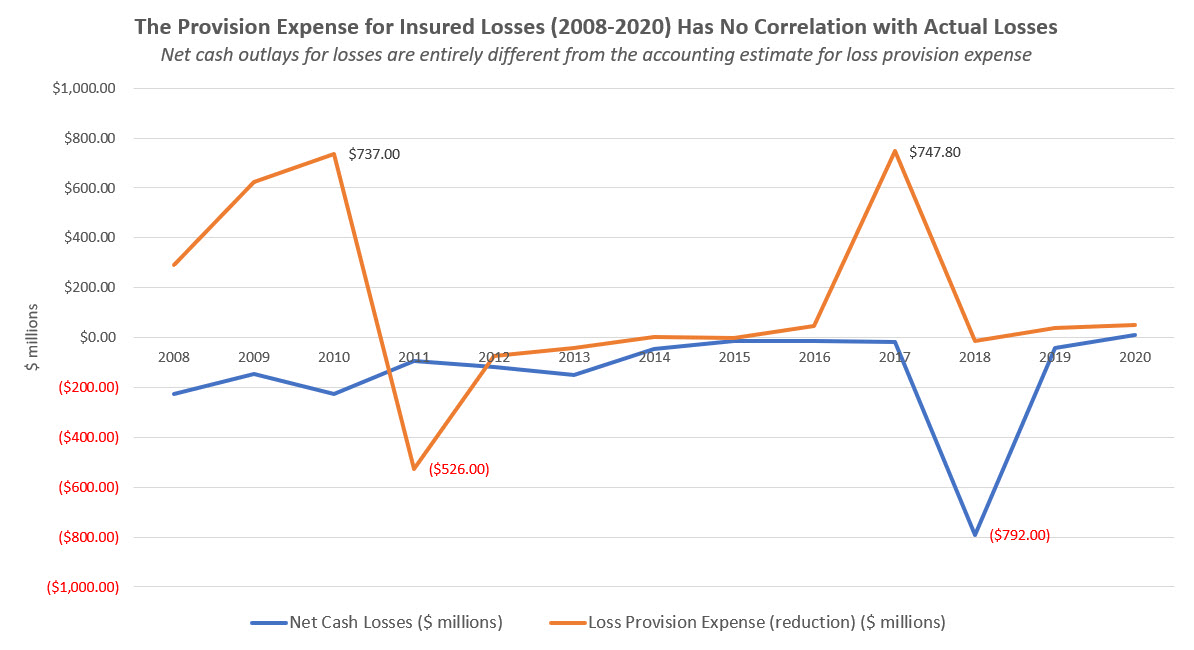
  • Bring more rigorous consistency to estimates of loss provision expense. Since 2009 there has been no relation between the provision expense and actual cash losses.
  • Shed greater insight into NCUA’s decisions including the management of its investment portfolio, the AME’s and the probability of premiums or dividends at yearend.

These accounting distortions have contributed to questions about the fund’s sufficiency and flexibility in a low rate environment. This is an important issue in the current environment. But it can only be analyzed if there is a rigorous, objective and consistent presentation of performance.

The fund’s revenue is primarily dependent on the yield on the investment portfolio. But whether that will be a factor causing a premium depends on two other critical events:

  1. What is the expected level of actual losses to the fund (versus the seemingly arbitrary loss provision expense)?
  2. Will the NCUA’s ever growing  expenditures transferred to the NCUSIF be brought into better alignment with proportionate share of state insured credit union risk?

Tomorrow I will present the NCUSIF’s cumulative performance from 2008-2020 to address the question, does the unique NCUSIF design still work after the two worst financial crises since the Great Depression?

NCUA Asks CU Owners for Guidance on Reserve Level in NCUSIF

Would a credit union ever seek members’ advice on its capital level? For example, should the net worth range be held at the “well capitalized” level of 7-8%? Or raised to match the industry average, currently 10.5%? Or, in this time of recovery, add an extra 1% for unforeseen risks such as the COVID shutdown of 2020?

It would be highly unusual, even unique, for credit union to do this. Now NCUA has asked credit unions to provide this guidance for the NCUSIF. In May, the board approved a request for comment from credit unions for setting the normal operating level (NOL). That ratio, expressed in basis points, determines the retained earnings over and above each credit union’s 1% capital deposit.

Deadline is July 26

This could be the most important action credit unions take to shape the future of their unique cooperative fund. This decision is so consequential that this week’s blogs will focus only on this topic. Using the fund’s data from 2008-2013, I will provide background, facts and a dynamic Xcel spread sheet to help credit unions in their responses. The comment period closes in just two weeks on the 26th.

All comment letters are available here. To date only one is posted.

The Issue

The traditional range of the NOL ratio has been the 1% deposit plus another of .2 to .3% in fund reserves. In 2017 the Board raised the NCUSIF’s upper NOL limit to 1.39%, supposedly as a temporary measure after merging the TCCUSF’s assets and contingent liabilities. That top limit was reduced to 1.38 in 2020.

The NOL top limit had always been 1.30 from 1984 until 2017. All fund balances above this cap must be paid to the fund’s credit union owners as a dividend. That is the legal requirement as outlined in NCUA’s comment request: “The Insurance Fund’s calendar year-end equity ratio is part of the statutory basis to determine whether the NCUA must make a distribution to insured credit unions. The Act states “the Board shall effect a pro rata distribution to insured credit unions after each calendar year if, as of the end of that calendar year . . . the Fund’s equity ratio exceeds the Normal Operating Level.”

For example for six consecutive years, 1995 through 2000, the NCUSIF paid over $500 million in dividends as the year-end equity ratio continually exceeded the 1.3% cap.

At December, 2020, NCUSIF’s $4.665 bn retained earnings were .318% of yearend insured shares of $1.468 tr. If the NOL cap had been 1.30 (not 1.38) credit unions would have received a dividend of $264 million.

Chairman Harper Has Stated His Views

Before becoming Chair, Todd Harper was outspoken in his admiration and desire to bring FDIC’s revenue options to the NCUSIF. He repeated this in a statement, NCUSIF Improvements, before the House Financial Services Committee in May, 2021. Here is an excerpt of his views:

“ . . .under current law, the NCUA does not have the appropriate flexibility necessary to manage the Share Insurance Fund in a manner consistent with the growing size and complexity of the credit union industry, as well as with broader national financial stability goals.

To address these concerns, the NCUA . . . requests the following legislative changes:

  • Increase the Share Insurance Fund’s capacity by removing the 1.50 percent statutory ceiling on its capitalization;
  • Remove the limitation on assessing premiums when the equity ratio exceeds 1.30 percent, granting the NCUA Board discretion on the assessment of premiums; and
  • Institute a risk-based premium system.

These recommended changes, if enacted, would allow the NCUA Board to build, over time, enough retained earnings capacity in the Share Insurance Fund to effectively manage a significant insurance loss without impairing credit unions’ contributed capital deposits in the Share Insurance Fund. Moreover, these changes would generally bring the NCUA’s statutory authority over the Share Insurance Fund more in line with the statutory authority over the operations of the Deposit Insurance Fund.”

Harper Seeks More Credit Union Money

Each basis point above the traditional cap of 1.3 is easy to calculate in dollars. With insured shares approaching $2.0 trillion, a single basis point adds $200 million to the fund.

Harper’s statement contains no facts or analysis supporting his legislative recommendations. His logic is only to cite the FDIC, a very different financial model. The bank’s fund has been insolvent several times since the NCUSIF redesign in 1984 ending the credit union’s premium-based system.

The reason Congress changed the FDIC’s operations in the 2010 Dodd-Frank Act was because it failed again in the 2008/2009 crisis. Congress kept the same design and as typical of a government solution, mandated that FDIC just collect more money from banks.

Harper posits three NCUSIF shortcomings: it is not sufficiently funded for times of stress; there needs be greater flexibility in financial management; and pricing should not be the same for every credit union–credit unions with more risk should be paying more. The bottom line is he wants to collect more money via premiums , an option now limited by law by the 1.3% cap.

The Real NCUSIF Failing

All three changes asserted by Harper are without supporting documentation. An analysis of the past thirteen years includes the two most recent financial crises and suggests a very different shortcoming. The NCUSIF has not lacked total resources, liquidity, or financial flexibility (premiums) but rather verifiable processes to estimate loan losses. For both specific and general loss provisions, NCUA has repeatedly overfunded the allowance account by hundreds of millions.

The most catastrophic example of this failing is NCUA’s estimates when initiating five corporate liquidations in September 2010. The projected credit union funded deficit from NCUA, versus actual outcomes to date, are more than $20 billion in error.

In later blogs, I will give examples of these loss exaggerations. These errors are even more pronounced when staff presents its modeling options to the Board in its annual NOL review.

NCUA’s efforts to remove these legal guard rails–NOL caps, mandatory dividends, external audits, limits on premiums—were anticipated. Spending more money is the default government solution. The NCUSIF and its co-op partner the CLF were tools to resolve problems collaboratively with the industry, not expense them away via liquidations.

Credit unions were put on notice by Chairman Callahan that the fund was now theirs, but they would have to monitor just like any investment.

The NCUSIF is Successful Despite NCUA’s Misjudgments

The strength and flexibility of the NCUSIF’s underwriting design has so far held against the agency’s habitual over-expensing ethos. There is a second concern. The accounting presentations are not provided in a timely, consistent and transparent manner-especially during high stakes decisions. A tool like the NCUSIF is only as effective as the quality of the data provided users.

Further blogs this week will cover these two issues and others:

  1. The Problems converting from private GAAP to federal GAAP in NCUSIF accounting. The importance of restoring private GAAP FASB accounting practices so the fund’s financial presentations are accurate, consistent and understandable.
  2. Facts versus fictions. How the NCUSIF’s 2008-2020 financial performance validates its financial design and the different approach in NCUA’s modeling outputs.
  3. Every Credit union’s NCUSIF calculator. This spread sheet is a simple, easy to use tool, that anyone can use to forecast the NCUSIF’s annual outcome and estimate whether a premium or dividend is probable at yearend.
  4. Raising Your Voice. Preparing Comments in light of the agency’s response to credit unions in 2017 when the cap was first raised above 1.30.

These blogs will provide interested persons historical context and the most recent data to review when submitting their responses.

 Current Whole Bank Purchases Illuminate Core Issues and a Glaring Deficiency

The five whole bank purchases by credit unions announced in 2021 illustrate the importance of answering the ten “transaction level” questions posed yesterday.  Each instances adds more complexity to those common issues . A review of these four credit unions’ actions follows.

  1. This month, Wings Financial Credit Union completed the acquisition of the $72.4 million Brainerd Savings and Loan, a Mutual Federal Savings Charter.

This in-market acquisition’s primary difference is Brainerd’s mutual ownership structure.  Brainerd and Wings cannot legally enter into a merger agreement, so the transaction is structured as a branch sale of Brainerd’s sole office, with a purchase and assumption of assets and liabilities, a voluntary liquidation of Brainerd, followed by a distribution of any residual assets to Brainerd’s mutual depositors.

Completed early in June, both parties have kept details private.  There have been no disclosures of valuation for assets and liabilities nor how the well-capitalized mutual’s reserves will be distributed.

Secrecy creates a situation lacking accountability.  How should depositors’ collective wealth be allocated to executives who facilitate the sale?  For the directors of both institutions, what is their fiduciary responsibility for disclosures to their owners?

Converting mutual banking charters serving the general public into private sales with no disclosure is an unsettling precedent. Because CEO’s and boards manage common wealth, respect for the values of honesty, openness, and trust are a vital factor of mutual and co-op design.  How will Wing’s leaders inform their member-owners about this use of their reserves and the benefits they should expect?

2. Vystar’s purchase of HSBI is the largest bank acquisition by a credit union to date.

Heritage Southeast Bancorporation, Inc. (HSBI) serves as the holding company operating three legacy brands Heritage Bank, Providence Bank and The Heritage Bank in their historical home markets. The holding company oversees $1.6 billion in assets and 22 branch locations across Southeast Georgia, through Savannah and into the Greater Atlanta Metro area.

The transaction combining these three previously independently owned banks was completed in September 2019.  Their independent business models focused on local commercial and real estate loans with virtually no consumer lending.

These mergers are the primary reason for the five-year growth shown below in Heritage bank’s assets:

Avg Yearly Asset

2016 = $409m

2017 = $445m

2018 = $490m

2019 = $1.055b

2020 = $1.457b


Its Pretax Operating Income Trails the Peer

2016 = 0.49% ROA (6th Percentile vs. Peer)

2017 = 0.92% ROA (14th Percentile vs. Peer)

2018 = 1.21% ROA (29th Percentile vs. Peer)

2019 = 0.37% ROA (1st Percentile vs. Peer)

2020 = 0.41% ROA (3rd Percentile vs. Peer)

When HSBI’s combination of three separate banks was announced in the fall of 2019, two CEO’s explanations were included in the newspaper story:

The combination is expected to offer shareholders several benefits, including ownership in a larger, more diversified and scalable company that has increased capital flexibility and operational effectiveness and efficiency, as well as improved liquidity in their shares.

“We look forward to continuing the ‘customer first’ cultures of each of our legacy organizations, while also providing our shareholders with a more marketable stock,” said Brad Serff, the President for the legacy Providence Bank division. 

“There are advantages to the merger,” Smith, CEO of The Heritage Bank said. “As a larger institution, we’ll have better resources, we’ll have more employees together obviously, and together we’ll just be stronger. We’ll have more effective buying power, we’ll gain efficiencies. 

Smith emphasized that on the client side, Heritage Bank will be able to offer a wider array of products, and the internal changes happening will affect the consumer or client in a minor way, if at all. Everybody worries about when banks do this, Smith said. But we’re the oldest bank in the area, and everyone else has done this.

“From a client standpoint, it should not change anything as far as the products and services we offer,” Smith continued. “In fact, the services could be enhanced. That is our intention. As far as what the client will see—the reality is, our branches are all staying the same, and the people are staying the same.”

Now all those assurances except one would appear unfilled.  HSBI stock certainly became more marketable, and fast.

Vystar is paying 1.80x tangible book value ($15.16 per share at 3/31/21) or $196 million for this bank combination that had yet to be fully implemented. The stock price jumped from $14.50 to $25 when the $27 share offer was announced. The market valuation prior to the announcement was only $105 million. This offer is a windfall for the new holding company’s shareholders.

The purchase price is approximately 22% of Vystar’s March 31, 2021, reserves. How will this transaction affect its net worth ratio now and in the future?

In addition to the financial issues are the challenges of an out of area purchase. HSBI’s headquarters in Jonesboro, GA, is 400 miles from Vystar’s headquarters.  The credit union has no brand recognition, legacy, or existing networking advantages in these new markets.

The HSBI consolidation was less than 18 months along. Each bank had retained their local identity.  Now another transition is needed for employees, customers and the communities served.

Small town banks, especially in commercial lending, are in the relationship business.  Will those advantages continue?   What benefits will Vystar bring to these markets which had just gone through an ownership change?

Yahoo Finance compares HSBI’s current stock price ($25 per share) to its earnings for the trailing 12 months.  At March 31 this ratio for HSBI’s  stock price is 177 times these trailing earnings, a stratospheric number.

Offering approximately two times book value for a company assembled a year and half earlier with a limited performance record seems sudden. Vystar’s challenge will be to convert their substantial premium and  three-bank unfinished combination into a competitive benefit for the credit union and its members.

  1. Lake Michigan Credit Union purchases Pilot Bank and its six Florida branches for $97 million.

The early June announcement of the credit union purchase of this Tampa-based bank caused the per share price to jump from $4 to $6 in less than a week.  At the agreed price of $6.25 for the 15,483 shares, this equates to a total value of over 1.8 times the bank’s March 31 book value.

Pilot bank focuses on commercial and industrial loans with a specialty in aircraft financing.   This will bring Lake Michigan’s west coast Florida branches to 19 (plus 46 in Michigan.)  The credit union says this further expansion into Florida is motivated to serve members who visit there in winter.

This transaction raises a similar set of challenges as for Vystar when expanding outside a credit union’s long time operational base. Tampa is 1,250 miles from Grand Rapids. Will the Florida customers and borrowers see the Lake Michigan brand as relevant to their local circumstances?

The price is 150% higher than the total market valuation before the announcement which makes the financial return especially important for this out of area investment.  The total purchase price would be approximately 10% of the Lake Michigan’s March 31, 2021, reserves.

  1. GreenState simultaneously purchases two banks with total assets of $1.1 billion.

On a credit union performance scale of 1-10, GreenState Credit Union would rank an 11.  Their numbers and service  are almost without peer.  This makes their  announcement on May 25 to buy two banks simultaneously unusual given their extraordinary in-state record.  One acquisition is in suburban Chicago and the second in Omaha.

Oxford Bank and Trust is headquartered in Oakbrook, Illinois and has six branch locations in Addison, Naperville, Plainfield, and Westmont. The press release says Oxford has assets of $730 million, with $405 million in commercial and consumer loans, $635 million in deposits and $71 million in capital.   The two headquarters are 220 miles apart.

Premier Bank established in 2011 is a locally owned, community bank serving the Omaha and surrounding areas, as well as the Nebraska City community. The bank has three branches in Omaha, and one branch in Nebraska City. At March 31, the bank reported $383 million in total assets with almost $40 million in capital.   Loans are primarily commercial and real estate.  GreenState’s head office  is 246 miles  from Omaha.

Both banks are privately owned so there are no public stock quotations.  No financial details were released.  However, the two institutions’ book value from FDIC reports is $111 million at March 31.  Both are stable, high performing and supportive of the sale to a credit union with which they apparently have no prior experience.

Assuming a purchase price of 1.75 times book value for the banks (no numbers were announced), that would equal $195 million or 27% of the credit union’s March 31 reserves.

GreenState raised $20 million of subordinated debt in the 4th quarter to add to its reserves.  Was this in anticipation of these purchases? Was this use in the supplemental capital application filed with NCUA?  If yes, that would seem to open a whole new purpose for supplemental capital.

These two out of area mergers raise the same questions as the previous out of state transactions. The GreenState brand is new in each market; both banks’ balance sheets focus on commercial and real estate, not consumer loans.  Implementing two on boardings, conversions and integrations at once will require an intense operational focus for the next 12-18 months.

“Market-based Transactions” & Other Observations

In early 2020 NCUA proposed changes to its rule (part 708(a)) on bank combinations. The proposal, currently in limbo, received almost 40 responses.

NAFCU’s comments on the proposal were supportive, stating that this is just the market at work, describing the bank’s decisions as “the best option available for consumers:”

Combination transactions are voluntary, market-based transactions that must receive approval from both the NCUA and the Federal Deposit Insurance Corporation (FDIC) and as such, should not be subject to overly prescriptive regulatory requirements that could put these transactions as well as affected consumers at risk.

Bankers’ baseless attacks on the credit union industry regarding the sale of banks to credit unions have raised false alarms—these are voluntary, market-based transactions, wherein the banks’ board of directors are voting to sell to credit unions as the best option available for consumers.

However actual events are more complicated than this defense.  Each transaction above for which the sale price is known is a significant commitment of capital (10-22%) and major operational undertaking. Unlike organic growth initiatives, these “opportunities” are brought to credit unions by consultants or brokers reaching out for ready buyers. The serendipity nature of these offers should remind that they may or may not readily match a credit union’s market vision or operational readiness.

The examples where a sale price is disclosed suggest that bank owners have mastered the art of buying low and selling high. This raises a question: why would these shareholders sell for cash if they believed their bank had this inherent future potential?

A former credit union CEO commented on these events: Credit unions enter negotiations with the idea of buying market share and bragging rights.  Who brags about buying a trophy?  Banks arrive at the table with one thing in mind– ROI.

What alternatives for organic growth are being pushed down credit unions’ to-do lists? Are GreenState’s in-state opportunities and appeal so saturated that venturing into suburban Chicago and Omaha are a better option for members?

Each credit union has previous purchase transactions. What were their customer retention  outcomes?  How long was payback on these investments?  In what way did these experiences benefit current members?

Others who have evaluated these opportunities claim that they come down to a simple buy-versus-build financial calculus when considering a new market:

“When I calculated the cost and effort to build my way into a new market with high barriers to entry, I proved to myself that the costs associated with acquiring a turn-key, profitable book of business was in the ballpark.”

An Unsettling Lack of Transparency

What is common to all five purchases is the lack of information to evaluate the transactions on impartial, objective criteria with market comparisons.

Relevant details are not disclosed before the deals are closed as occurs in most bank-to-bank purchases.  Such public scrutiny can dampen excesses that may occur when core facts are not disclosed.  This secrecy also prevents the credit union system from learning from these examples.  The expertise relied upon now is at best conflicted as their compensation primarily comes when closing the deal.

These purchases have significant consequences for members, their credit union, the customers acquired and the employees and communities where the banks are operating. The credit union’s value proposition should be in writing and available to all affected parties.

Because coops manage “common wealth,” transparency is a critical leadership competency.  Without relevant information, confidence in these transactions is difficult to support.  Sooner or later, this lack of openness could lead to disappointing outcomes—but the sellers will have already taken their money to the bank, so to speak.

Chapter III will review what the member-owner’s.role should be in this use of their collective capital. They are not only owners but also the beneficiaries, or losers, should these deals turn out to be poor decisions.

Ten Questions for Whole Bank Purchases     

Some proponents assert that buying banks is just another market option for a credit union.   Similar to expanding a branch network, investing in technology or launching a rebranding campaign, this is just a business decision that needs to be “pencilled out” to see if it makes financial sense.

Analyzing a purchase transaction is not simple.  Every transaction has a different market context and unique financial data.

Ten Questions Before Any Purchase

Credit unions buy banks with cash, not stock, which is the common practice in bank-to-bank purchases.  Some data provided in bank announcements to enlist shareholder support are also relevant for credit unions.

The following list focuses on evaluating the purchase transaction itself, not the broader public policy implications or a credit union’s strategic framework.

  1. What will be the total expenses of the transaction for all fees, consultants, contract cancellations etc., and how will these costs be recorded by the credit union? What transparency will the credit union provide to demonstrate its own due diligence work.
  2.  What is the dollar total of bank assets and/or liabilities the credit union must sell as ineligible for a credit union charter? If significant, why is the merger being considered?
  3.  How will key personnel be retained and will there be a cultural fit? What obligations will the credit union have to the former executives and employees of the bank? Will covenants or conditions such as non-compete clauses limit major stockholders, senior and/or key executives whose stock has been paid out from becoming competitors. An observation from a merger veteran:  Credit unions talk about “buying” skills during a merger.  If you can’t keep a commercial lending team, mortgage banking team, wealth management team, then you are not buying anything.  Those jobs are like free agency – they sell their skills to the highest bidder.  You are not acquiring a piece of equipment, a patent, or a manufacturing process, you are buying people.  This is a service and relationship (networking) industry.  A star performer can take their network (and team) anywhere.  A merger is often the “nudge” the star performer needed to make a change to a different employer.  If they don’t see a direct benefit from the merger, you run the risk of losing them.
  4. How will the transaction affect the credit union’s net worth position? If all bank capital is absorbed in the acquisition, will the credit union remain well capitalized and able to realize its growth prospects in the newly obtained market?
  5. How will the additional assets affect the credit union’s overall ROA, efficiency, and concentration ratios? What is the payback period (breakeven) on the cash paid out in the transaction? How do various customer retention scenarios affect this return?(Proforma balance sheet and income statements before and after the purchase are useful in addressing these changes.)
  6. How much overlap with current markets exists? If high overlap, why merge to begin with?  If low overlap, is the credit union reaching too far from its geographic core?  How will an investment in a market where the credit union has no presence benefit current members?
  7. How will the bank customers become “involved” credit union members? These bank customers did not choose the credit union, have no direct experience with it and are probably unfamiliar with their acquirer. Can the credit union retain these relationships plus gain new ones?
  8. Why did the credit union pay a premium over the market valuation for this transaction? If the franchise is so desirable, why were there no other bids? How will existing market competitors–bank or credit unions–react?  Will there be critical comments such as taking away jobs, tax revenue, deposits, and local leadership from the community? Might competitors hire away key personnel?
  9. What are the regulatory requirements to be navigated? Will FDIC require public announcements be placed in affected markets?  What process will each regulator follow when evaluating the purchase—will different criteria be used for the FDIC and NCUA? Depending on the selling bank’s structure, will potential double taxation affect the price–  once on the asset value increases in liquidation and again on gains from shareholders’ stock sale.
  10. What existing plans will this acquisition defer, disrupt or postpone? What new risk mitigation measures will this event require?

Knowing questions to ask in any undertaking does not lead to easy answers. Any list of due diligence questions is incomplete as each circumstance introduces special factors.

However, using a check list can help assemble the basic information and analysis to consider versus the generalizations sometimes used to justify these purchases.

Tomorrow I will look at the four current transactions and their individual explanations.


Chapter II: Bank Purchases by Credit Unions: Just Another “market transaction?”

(Two blogs precede this chapter II. One posed the issues of credit unions buying banks; a second reviewed cooperatives’ public policy role.)

As of mid-June, four credit unions have announced agreements to purchase five whole banks. Each of the four purchasing credit unions—Lake Michigan, Vystar, Wings Financial and GreenState (buying two banks at once)—have had prior instances buying a whole bank and/or branch combinations.

These events raise both policy and transaction questions. One explanation by NCUA and trade associations is that whole bank purchases are “just the free market at work.” Nothing out of the ordinary. Two independent firms make decisions in the interests of both sets of owners and their communities.

Not Market-Tracking Decisions

However, this explanation is neither complete nor useful. It is incomplete because only one side of the sale is open to owner scrutiny—the selling bank which must have shareholder approval. The credit unions purchasing the assets and liabilities act like private buyers. They rarely release any factual or financial data except press release generalities such as market expansion, diversification, acquiring new lines of business or adding professional expertise.

When facts about the transaction—such as the sale price– are presented, they are from the seller’s briefing their owners not by the purchasing credit union.

In a “normal” market-driven bank purchase (or merger via exchange of stock) both parties will provide their rationale for the transaction. Here are several excerpts from 2021 sale announcements provided by the bank undertaking the purchase, not the selling party:

BancorpSouth said it expects to have $125 million in merger-related costs. The bank said it plans to save $78 million in annual non-interest expenses as a result of the merger. The bank plans to achieve 75% of its merger-related cost savings by 2022, and 100% in 2023. or,

Webster plans to cut about 11% of the combined entity’s annual noninterest expenses, American Banker reported Monday. The company expects to incur $245 million in merger-related expenses, but the deal is projected to save $120 million while the company generates an extra $440 million per year. or,

NYCB and Flagstar: Accelerating Our Transformation Strategy: NYCB estimates the merger will result in additional capital generation of $500 million annually, as well as $125 million in annual cost savings. The bank expects to incur $220 million in merger-related expenses. (the release includes full operational and financial estimates)

Each of these purchasing banks provides data about the transaction, how it will benefit shareholders, goals for cost recovery and the expected return on investment in following years.

Credit union purchases convert firms subject to market monitoring into private entities. No longer can external markets assess management’s performance. Coop member-owners are not involved in the process before or after.

Investing Beyond a Firm’s Experience

In many areas of commercial enterprise there are wealthy individuals or firms who jump into an industry by “investing” in competitive arenas different from where they made their wealth. Consider Silicon Valley entrepreneurs buying professional sports teams, wealthy heirs venturing into the film and entertainment business, young work-from-home retail investors jumping into $0 cost online stock trading, etc.

Long time professionals sometimes refer to these new entrants’ cash inflows as “dumb money”–affluent outsiders bitten by a bug to try something different or indulge a personal interest. And there are plenty of brokers, salespersons and expert third parties helping these newbies learn the ropes and get into the business—for a fee.

These promoters make their living by closing deals. Their most common message is urgency–“act now or miss out” — if you don’t, someone else will take this opportunity off the table.

But how is an interested credit union member supposed to weigh such an event? One approach is to ask if the member would buy the bank’s stock for their personal investment based on the information available to their credit union?

Would You Buy This Bank’s Stock?

Too difficult for a member? Here is an actual case.

A $605 million credit union announced in July 2019 an agreement to buy all the assets of a bank with the following performance record:

  • June 30, 2019, bank data: $97.8 million in bank assets, $77.6 million in deposits; $11 million in equity; a $7.0 million FHLB loan; and loans of $73.7 million.
  • The bank has had negative income every year since 2008.
  • The “efficiency ratio” for 2018 was 111.08% and for 2017, 129.0%. At June 2019, 127.8%. Every period’s operating expenses have exceeded income.
  • Two consent orders were issued by the Office of the Comptroller of the Currency. The December 19, 2012, one was followed by a second on November 2015 designating the bank a “troubled institution”.
  • This order was ended in February 2019 after the bank raised $4.5 million new capital issuing 600,000 new shares for a price of $7.50 per share in January 2018. The cost of the offering for the bank was $366,000 or 8.1% of the gross proceeds.
  • The bank’s 2018 annual report states its core market deposit shares as: 1.69% Arlington Heights, 2.83% Rolling Meadows, and .03% in Cook County.
  • The 2018 annual report included the bank’s outlook: We do not anticipate net income until we experience significant growth in our earnings.At mid-year 2019, just before the credit union announcement, the bank’s operating loss was $262,000.

Would a person buy this bank’s stock that has not had positive earnings for a decade, promises none going forward and has miniscule market share? The new investors in 2018 paid $7.50 per share; the day before the announcement the share price was $6.80-below what the new investors paid.

The credit union offered $10.33-$10.70 per share or $2.4 million higher than the book value and 55% higher than the market valuation prior to the sale.

The credit union addressed none of this operating history, even though the facts were public. The credit union offered no information about how this decade long losing operation would benefit it or the members. The purchase was finalized by Corporate America Family Credit union and announced on April 30, 2020.

Why did the credit union bail out this bank’s owners with their members’ collective capital? How will this $13-$14 million dollar “investment” provide any return for the credit union? No one knows; the outcome is now hidden away from external or internal oversight. On the public facts, this would not appear to be a “smart money” move.

Tomorrow I will provide critical questions to evaluate these purchase transactions.

The Corporate Resolution: Hard Truths and the Need for an Objective Lookback

The most disastrous event in the 110-year credit union story, the corporate crisis of 2008/9, has created its own myths and interpretations. The good news is that most credit unions successfully navigated the burden of paying billions of unneeded premiums.

The downside is that there has been no change in NCUA’s unilateral ability to impose its internal resolutions on problems unchecked and lacking objective data.

Edwards Deming, the founder of the quality improvement movement, stated: “Without data you are just another person with an opinion.” Opinions of the corporate events have always been plentiful and often predictable, from 2009 to today.

The latest March 2021 AME quarterly financials show NCUA’s 2010 loss forecasts and current outcomes differ by over $20 billion.

Common sense requires an independent factual commission analyze the entire event so this kind of catastrophic mistake never happens again. This is not an exercise in 20:20 hindsight. It is to prepare a full record from contemporary data, documents and participants to prevent future ruinous system outcomes.

Here’s the latest data and comparisons with NCUA’s forecasts.

AME Surpluses Grow to $3.125 BN

Total projected distributions to members of four of the five corporates now total $3.125 bn. This is an increase of $95 million from three months earlier.

Credit union shareholders in Members United and Southwest Corporate will receive 100% of their capital, plus liquidating dividends projected at $14 million and $307 million respectively, for a total of over $1.3bn. Both reported millions in regulatory capital in their August 2010 call reports before being taken over by NCUA.

WesCorp’s Deficit at $2.175 Bn

Only WesCorp shareholders will receive no distribution on their $1.114 bn of member capital. NCUA estimates the NCUSIF loss on WesCorp’s estate will be $2.2 bn. (AME: B4 Due to government)

NCUA’s Liquidation Expenses Exceed 10 Years of Operating Budgets

Section B 1 of the AME financials, “Liquidation Expenses,” reports total operating costs paid from each of the five estates of $4.786 bn. Subtracting expenses for legal recoveries (line 15) of $1.258 bn, NCUA has spent $3.528 bn administering the corporate resolution plan.

This net amount exceeds all of NCUA’s combined operating budgets from 2010 through 2020 in its oversight of 5,000-6,000 credit unions, the NCUSIF and the CLF.

Moreover, these “expenses” do not include realized losses charged to the AMEs of over $1.0 bn. NCUA incurred those additional losses by selling non-legacy, fully performing investments immediately after seizing the credit unions in 2010.

Total Surplus Approaches $6.0 Billion

NCUA boasts of the net legal recoveries of $3.8 bn. However, that amount would just pay for NCUA’s TCCUSF administrative expenses with only a $200-$300 million overage.

The growing combined surpluses of nearly $6.0 bn from the AME estates and the TCCUSF merger are from the “legacy” investment payments of interest and principal. Expected losses forecasted in 2009 years into the future, and expensed from capital, were billions in error. Instead of recognizing losses as incurred, they were written off all at once based on faulty modeling assumptions of future cash flows over the securities’ remaining lives.

TCCUSF Forecasts Billions In Error

When the TCCUSF was merged on October 1, 2017, its entire surplus of $2.562 million was transferred into the NCUSIF. However, when the liquidations commenced in 2010, NCUA projected a loss of $8.3 to $10.5 bn in the TCCUSF. This one aspect of the resolution plan’s outcome was in error by $10.6 to $13 bn.

NCUA estimated the range of total resolution costs after seizing the five corporates at $13.9-$16.1 bn. Projected recoveries were $0. The $5.6 bn extinguished credit union capital was gone forever. Additional TCCUSF assessments from credit unions ranged from $7.0-$9.2 bn.

These total AME estimates were off by over $20 billion when adding the growing surplus to this loss forecast.

These Resolution Costs Detail estimates of July 2010 were disclosed only after the seizure and liquidations were undertaken. At the same time the KPMG audit of the TCCUSF (note 6) projected a total loss of $6.4 bn at December 2009 across the entire corporate network. This audited loss provision estimate was not released until December 27, 2011, or 15 months after the liquidations commenced.

In contrast, at June 30, 2010, just prior to the five seizures, the 27 corporate call reports showed the entire system reporting gains in reserves of $260 million and significant reductions in AOCI (all other comprehensive income) of over $8.8 bn versus June’s 2009 totals.

Every corporate reported improving financial results as financial securities recovered from the depths of the market dislocations in early 2009. Instead of recognizing these positive trends, NCUA imposed a second crisis on the system by liquidating the five corporates.

The Members United Example

Corporates and the entire economy were on a visible recovery trend when NCUA initiated its September 2010 liquidations. One example: Members United had expensed $600 million in estimated OTTI credit impairments, but had incurred actual losses of only $95 million according to its final call report on August 2010. Its reported changes in the monthly valuation of its investment dislocations (AOCI) had gone from a peak decline of $2.1 billion (March 2009) to $917 million in its final 2010 call report.

Seven years later at the merger of the TCCUSF with the NCUSIF, Member United’s legacy assets had incurred only $297 million losses versus the $600 million expensed. The latest AME March 2021 financials show Members United shareholders will receive $605 million from interest and principal pay downs on their corporate’s “legacy” investments.

Independent Review Critical to Learn Hard Truths

The organization ultimately responsible for the safety and soundness of the credit union system is NCUA. The agency had the resources and authority to lead a mutual least cost outcome. Instead, acting unilaterally, in secret with no communication with those closest to the events, the agency abruptly closed the four largest corporates plus the $1.2 bn Constitution Corporate. The agency justified these actions by publishing loss projections significantly greater than KPMG’s audited numbers.

The agency that was supposed to protect and keep the system safe turned into its prime executioner. Did no one object to the plan? Were no alternatives reviewed? What factual data was the basis for the actions when all the 5310 monthly reports showed recovery was underway?

The billions in unnecessary TCCUSF premiums, the denigration of corporate personnel and their network’s critical contributions, the effective dissolution of the CLF’s liquidity safety net, are all disastrous individual events.

But the ongoing harm is even greater. Credit unions’ trust in the agency and its willingness to work mutually with credit unions is still in doubt. The agency shut itself off from public dialogue, asserting its independence and provided no timely information or objective data—all characteristics part of its current culture.

Reform will only occur when this past event can be honestly presented. Facts should be the basis for truth; and the voices that were ignored or blamed, should be asked their points of view.

Without a transformation in NCUA and credit union interactions, the cooperative option will seem at best, disjointed; at worst, a system where the NCUA’s accountability for safety and soundness is still absent.

We will never know if wiser leadership might have avoided this regulator-induced catastrophe. The purpose of an independent, expert commission is not to change the past. Rather it is to inform future regulators, wanting to act unilaterally, from sending more credit unions over the cliff.

The Declaration of Interdependence

Richard Blanco’s mother was seven months pregnant when his parents left Cuba for Madrid, where he was born.  Forty-five days later they departed for America.

Technically his full name is Ricardo de Jesús Blanco Sánchez Valdez Molina.

His parents so wanted to come to the US they named their son Ricardo, after Richard Nixon.  Jesus, because his mom on the flight from Cuba said, “If we make it alive, her(sic) middle name will be Jesus.”

And as a poet he calls himself Richard to contrast the Anglo and the white Blanco.  He is a lifelong civil engineer.  He read a poem at Barrack Obama’s 2013 inaugural, the first Latino to do so.

A Poet’s Political Conscience

He was moved to write Declaration after hearing Senator Jeff Flake’s speech in the Senate on  America’s divisions in 2017.  The Senator said in part:

“I rise today with no small measure of regret — regret because of the state of our disunion, regret because of the disrepair and destructiveness of our politics, regret because of the indecency of our discourse, regret because of the coarseness of our leadership, regret for the compromise of our moral authority, and by ‘our,’ I mean all of our complicity in this alarming and dangerous state of affairs. It is time for our complicity and accommodation of the unacceptable to end.”

In this prose-poetry format, Blanco selects phrases from the Declaration of 1776 and contrasts these with observations about the present.  He concludes with the self-evident truth: We’re the promise of one people, one breath declaring to one another: I see you. I need you. I am you.

             Declaration of Interdependence

By Richard Blanco

Such has been the patient sufferance…

We’re a mother’s bread, instant potatoes, milk at a checkout line. We’re her three children pleading for bubble gum and their father. We’re the three minutes she steals to page through a tabloid, needing to believe even stars’ lives are as joyful and bruised.

Our repeated petitions have been answered only by repeated injury…

We’re her second job serving an executive absorbed in his Wall Street Journal at a sidewalk café shadowed by skyscrapers. We’re the shadows of the fortune he won and the family he lost. We’re his loss and the lost. We’re a father in a coal town who can’t mine a life anymore because too much and too little has happened, for too long.

A history of repeated injuries and usurpations…

We’re the grit of his main street’s blacked-out windows and graffitied truths. We’re a street in another town lined with royal palms, at home with a Peace Corps couple who collect African art. We’re their dinner-party talk of wines, wielded picket signs, and burned draft cards. We’re what they know: it’s time to do more than read the New York Times, buy fair-trade coffee and organic corn.

In every stage of these oppressions we have petitioned for redress…

We’re the farmer who grew the corn, who plows into his couch as worn as his back by the end of the day. We’re his TV set blaring news having everything and nothing to do with the field dust in his eyes or his son nested in the ache of his arms. We’re his son. We’re a black teenager who drove too fast or too slow, talked too much or too little, moved too quickly, but not quick enough. We’re the blast of the bullet leaving the gun. We’re the guilt and the grief of the cop who wished he hadn’t shot.

We mutually pledge to each other our lives, our fortunes and our sacred honor…

We’re the dead, we’re the living amid the flicker of vigil candlelight. We’re in a dim cell with an inmate reading Dostoevsky. We’re his crime, his sentence, his amends, we’re the mending of ourselves and others. We’re a Buddhist serving soup at a shelter alongside a stockbroker. We’re each other’s shelter and hope: a widow’s fifty cents in a collection plate and a golfer’s ten-thousand-dollar pledge for a cure.

We hold these truths to be self-evident…

We’re the cure for hatred caused by despair. We’re the good morning of a bus driver who remembers our name, the tattooed man who gives up his seat on the subway. We’re every door held open with a smile when we look into each other’s eyes the way we behold the moon. We’re the moon. We’re the promise of one people, one breath declaring to one another: I see you. I need you. I am you.