The Creighton FCU insolvency resulted from the sudden discovery of a $13.6 million hole in this reportedly $67 million asset credit union. The failure, NCUA’s largest in 2024, is apparently an unsolvable mystery. One in which the only suspect has died. As I first posted, NCUA has provided not a single fact about where any of the money went. Just speculation.
More incredible is the IG suggestion that there is no money missing, just a bunch of accounting errors. Moreover, no one seems very curious about finding out where money went. In the IG response to the Congressional inquiry he opens with the statement: “my office was not required to perform a material loss review. Additionally, NCUA informed us that the agency was not required to conduct a post-mortem review.” In other words, don’t look for any answers from us.
The one IG explanation is that the CFO, who died in April 2024 leading to the shortfall’s discovery. was covering up actual operating losses for up to 26 years. We’ll examine this idea later. In the IG’s summary review, no one within the credit union or NCUA examiners and external CPA auditors apparently saw any indications of irregularity during three decades.
The IG further assures Congress that an over “20 year review” of the CFO’s family records reveals no unusual credit union cash diversions. Yet this is still the person who carried out this cover up apparently alone, fooling every check and balance and division of duties for such an extended scheme.
Blaming a person no longer around, and who apparently took no funds, feels too convenient. Let’s look at the plausibility of the IG’s theory and facts we do know.
The Cash Came In
We know the members deposited the cash and the funds which went missing. When the $13.6 million shortfall was discovered, this hole was covered by underreporting shares by an almost equal amount. Shares balances in the March 30, 2024 call report were $61 million. Ninety days later the total reported by NCUA in their exam and the June call report was $74 million. This is the exact total change in net worth. And the same order of magnitude ($74 million) for Creighton members’ share liability when merged with Cobalt.
But where did the cash go? Here is the IG’s “official explanation” after reviewing all the information he reviewed:
NCUA officials believe the credit union failed due to bad accounting and financial statement fraud. The large deficit was hidden by the former CFO who exploited Creighton’s weak accounting system that allowed back posting, forward posting, deleting transactions, and hiding general ledger accounts when generating reports. Because no money was found to have left the credit union through this, NCUA officials believe the former CFO committed the fraud not for personal financial gain, but to make the credit union appear to be thriving in the eyes of its Board and membership.
The IG’s “Thriving by Hiding” CFO Motivation
Reread what the IG just asserted. Although we know the $13 million member deposits came in, “no money was found to have left the credit union.” This CFO was cooking the books just to hide operating losses for 26 years. This is what the IG wants us to believe?
Cash shortfalls creating a cumulative deficit can only occur if the credit union pays out that cash in some form (hidden operating expenses, fraudulent loans, fake withdrawals, phoney investments etc) What were those payouts? Some entity or person received these cash diversions hidden by accounting coverups for decades.
A brief IG reference is made to the management of the credit union’s 150 ATM’s for which the accounting was difficult to reconcile. This should have prompted questions such as, what accounts were used to fund the ATM operations? Who managed the cash deliveries and cash drawer balancing when machines were serviced? Was there an external servicing contract or were cu personnel responsible? The IG letter states: Fraud auditors reviewed ATM and lease payment accounting transactions. The regional director stated that the ATM accounting was extremely complicated due to Creighton having over 150 ATMs and the multiple ways in which income and expenses could be divided.”
The IG statement is an NCUA and auditor admission they could not figure out what was going on. Managing 150 cash receiving and paying ATM’s is similar to having to reconcile 150 teller cash drawers periodically. Cash comes from deposits and checks, and cash is with withdrawn by members from their share accounts.
NCUA’s Regional Director is reported to find that “ATM accounting was extremely complicated.” This is what should be expected from covering up a missing $13 million. But not a single instance of imbalance or shortfall is cited. Or even a reference to how the machines were managed.
And the closest we get to the smell of a smoking gun is not from NCUA or outside auditors, but from Cobalt which is quoted in the IG report:
“NCUA officials advised (note the passive voice) that in early October 2024, they learned from Cobalt that after the merger, Cobalt determined that the former CFO understated expenses related to the ATM network to artificially boost Creighton’s income statement to appear to achieve a steady net income. The IG continues:
“Cobalt surmised that the former CFO was either not booking the monthly ATM expenses at all or was severely understating the expenses. Cobalt indicated the ATM costs alone should have been $255,000 each quarter. They determined the CFO booked around $120,000 per quarter to the office Operations account. Cobalt officials explained to NCUA officials that this would account for an approximate $500,000 to $550,000 reduction in net income per year if no other expenses were booked to the Office Operations account.
Cobalt officials explained that over more than 26 years, such an understatement would easily account for the $12.5 million deficit.”
One can only say Wow! to this explanation from Cobalt. NCUA did not make this finding. ATM expenses are for cash outlays for withdrawals and network operations. The bottom line is that someone or some entity was paid the money. Who wrote and signed the checks for these underreported expenses? The IG report makes it appear it was all just confusing bookkeeping.
Putting the Blame on a Fall Guy
Cash from members shares came in and $13 million cash ended up missing. For 26 years it was all the “fault” of a person no longer living. Which means that all of those who were simultaneously responsible for the safe and sound operation are let off the hook.
Among these listed in the IG letter are the CEO of 32 years, a senior accountant, the board, the supervisory committee, the outside auditor, special auditors and multiple NCUA officials from the supervisory examiner, problem case officers up to the RD’s office.
These were not just persons called in to observe a financial autopsy. They were directly responsible for this institution’s safe and sound operation in their various capacities in the many years before this failure came to light. Yet we read not a word about their roles including the person who oversaw the CFO and his senior accountant staff this entire time.
The Reported and Reconstructed Net Income
Here is what we know from the most recent eleven yearend call reports prior to June 2024.
Creighton FCU’s Reported Financial Performance
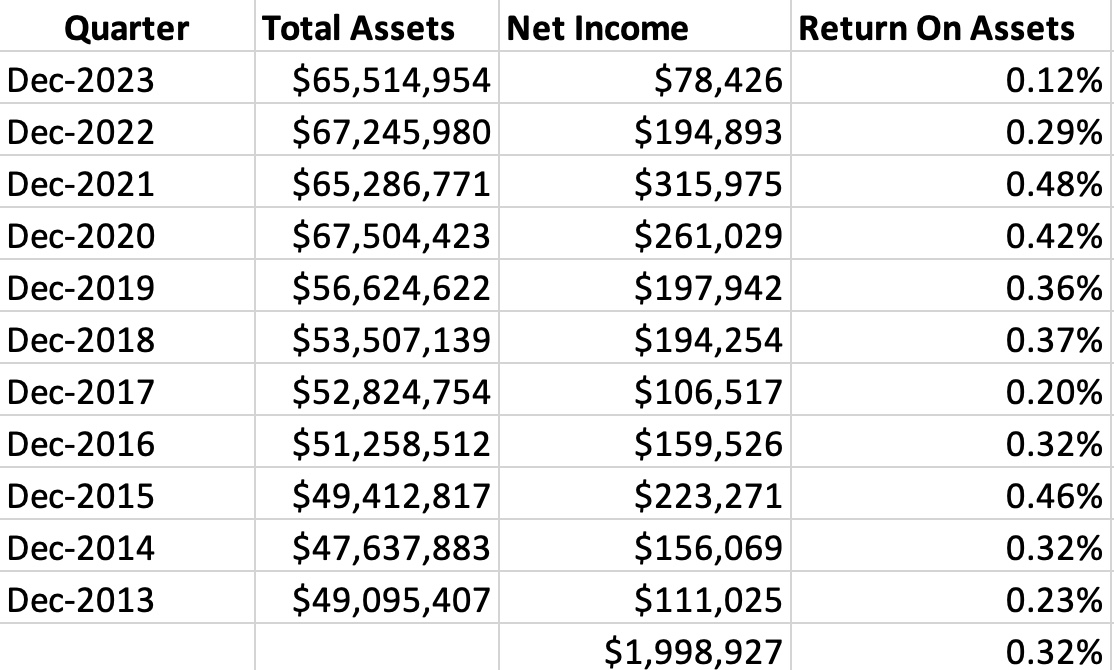
OK performance, but certainly not world beating. If one believes the IG’s theory, then the real result in this most recent eleven years was an operating loss of $5.5 million from ATM “expenses” plus false net income of $2.0 million. A $7.5 million difference somehow hidden by creative accounting.
However if one presumes a steady cash diversion as the problem, then adding back the estimated $500,000 or more per year means the credit union actually made $7.5 million—most of which was “expensed away.” This earnings would equate to an average ROA of 1.2% or four times the net in the call report. And a reasonable possibility.
The cash from member share growth came in. The cash went out the door as an “operating expense” somehow, somewhere.
A diversion of this magnitude for this long would seem to require several participants. Presumably the ATM’s were not deployed all at once. A system of diverting cash was initially set up and expanded as the network grew. Was some entity or person(s) servicing the machines somehow involved? Other credit union employees had to balance the ATM total cash receipts and disbursements to the general ledger. There had to be a system for quickly producing expense and suspense entries to cover up the missing cash for exams and auditors. No one person could fill all these roles.
Since the share shortfall was quickly found suggesting a second set of books, there is probably a similar recurring system for diverting cash to sustain this activity for decades.
All the people listed in the IG reports were in the room when this happened. But none of them was apparently asked for an explanation of how this could have occurred on their watch. For example how could the CFO have “managed” the expected net income without first talking to the CEO about the results?
After reviewing 20 years of the deceased CEO’s family records, and finding “no improper transfer of credit union funds”, the IG’s simple explanation is that “that the CFO hid this $12 million deficit by exploiting the credit union’s weak accounting system.” But how long had this “weak accounting system” been in place?
The lack of any IG mention of NCUA exam and CPA responsibility for “weak accounting” suggests a reluctance to learn who is accountable for what in this failure. Instead put the blame on the person no longer available, and who took nothing.
Questions the IG should have asked include: What were the examiners’ CAMEL ratings in the most recent years? What did the supervisory committee do? How did examiners record the problems of” back posting, forward posting, deleting transactions, and hiding general ledger accounts” now offered to explain the inability to find the shortfall? Did the CPA firm give a clean audit opinion?
The NCUA and IG’s failure to look at the standard processes for oversight and accountability reflects a flaw in the agency’s own structure. Handing problems over to another credit union to cover up NCUA’s supervisory failures, will only lead to more such failures.
Throwing a Credit Union Under the Bus
Cobalt FCU and their members are taking the hit for Creighton’s financial and supervisory failures. The immediate results of the Creighton merger in the September 2024 quarter include a share inflow of over $73 million; a reduction in undivided earnings of almost $7.0 million (from $115.6 to $106.5–( i.e. Creighton’s negative net worth); and an increase of 6,700 members versus declines in the immediate prior quarters.
Additionally, Cobalt’s net income from ongoing operations reported a $400,000 third quarter loss. The year to date net income is a negative $2.2 million. These combined changes resulted in Cobalt’s net worth falling to 8.1% from 9.2% at the September 2023 quarter end.
A Case Study of Failure-at All Levels
In the IG’s reply to Congress, he states one of the objectives was to report on:
the effectiveness of the National Credit Union Administration’s (NCUA) examination and oversight processes in detecting and preventing financial irregularities, and the role and performance of external auditors in this case. The letter covers none of these issues.
At this time no one yet knows where the missing cash has gone. NCUA has not worked very hard to get critical information on the event. The IG mentions a possible explanation suggesting there is no missing money-just accounting confusion. But the $13 million of member funds is gone.
NCUA seems to have distanced themselves from any further explanations, even citing Cobalt for the latest accounting examples. Yet overseeing the safe and sound operations of credit unions is NCUA’s number one priority. NCUA failed totally and quickly moved on in this case. They have literally closed the books, fended off queries and said there is nothing more to see here.
If this sudden $13 million failure is not a wakeup call, when will the senior leaders of the agency step up to the mike and take responsibility? The NCUA board is responsible for governing the agency, not staff.
The Board’s silence and turning over responses to the IG for a Congressional inquiry for its largest cu failure in 2024 is a leadership failing. The agency’s no comment and the IG’s second and third hand reporting, undermines pubic trust and confidence in NCUA’s administration. Congress, credit unions and the public want to hear from their leaders in a crisis, not the bureaucracy.
Perhaps it is time for a real change at the NCUA board.