My earlier analysis, part 1, of the NCUSIF’s financial performance in 2024’s first three quarters, highlighted the fund’s soundness. It concluded with Board member Otsuka’s statement about the board’s role to be good “stewards” of the fund. This post shows how that oversight role could be improved.
The Benefit of Public Board Meetings
The board’s quarterly discussion of the fund’s performance is an important responsibility. It demonstrates each board member’s “grasp” of the subject matter, their preparation and their reasoning for any conclusions. Just like a credit union board’s role, their judgment is critical in overseeing staff’s recommendation.
It is in the board’s particular roles in this quarterly review, that the public learns each member’s understanding of general policy, especially the role of America’s cooperative financial alternative.
Additionally, NCUA’s monthly publication of the NCUSIF’s performance provides the fund’s cooperative owners the opportunity to monitor how their 1% deposits are managed by following critical financial indicators. This monthly update was a condition for the open-ended funding model of the 1% deposit by credit unions. If the trends are in the wrong direction, then credit unions have the facts to speak up.
Critical NCUSIF Financial Issues
The fund’s finances have one primary revenue driver, the yield on the investment portfolio. This was by design. It was a dramatic change from the premium based approach of the FSLIC and the FDIC which was also followed for the first 15 years of the NCUSIF’s operations. That premium model proved fundamentally flawed. That history is described at the end of this post.
The NCUSIF’s Investment Underperformance
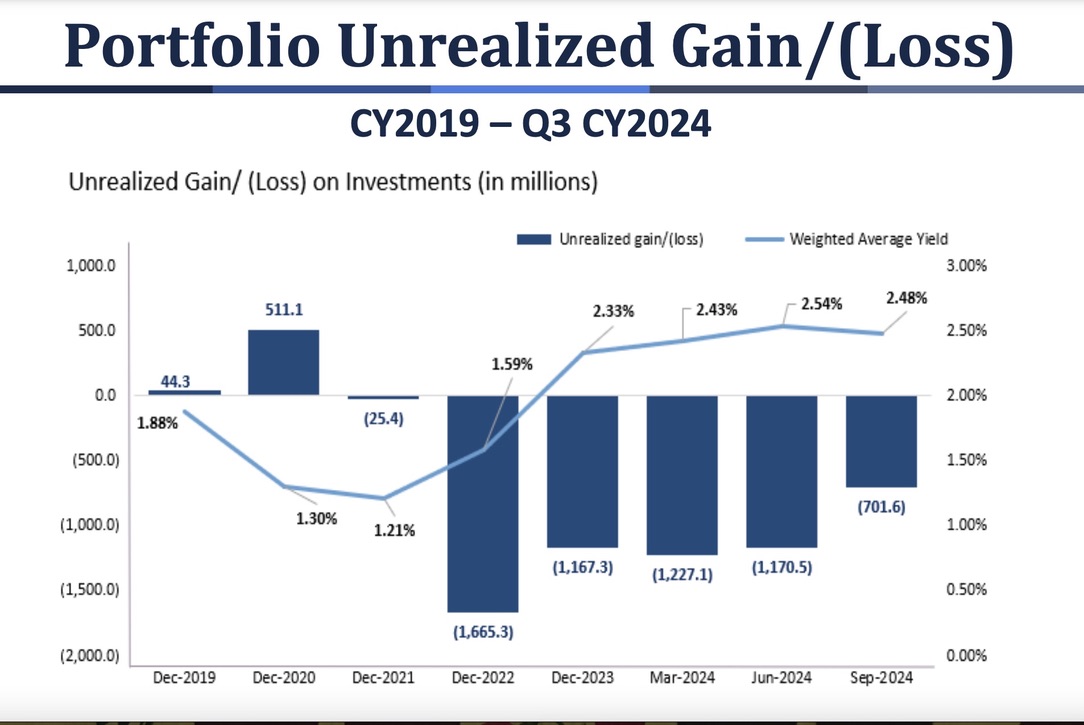
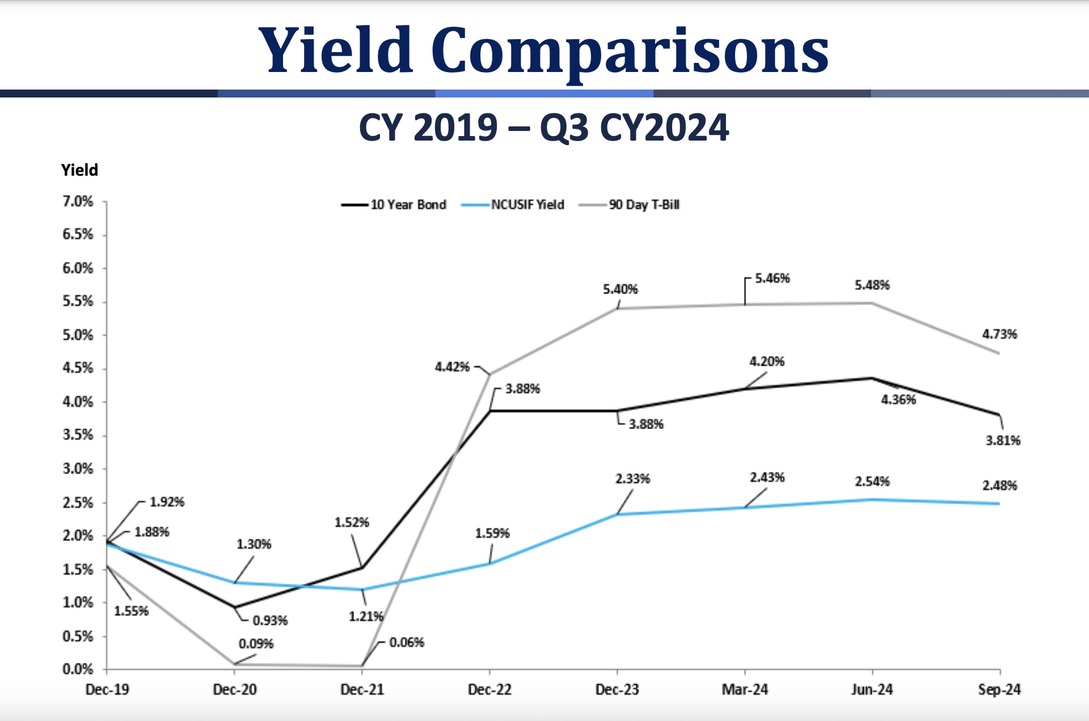
Slides from the September financials in November meeting clearly demonstrates the agency’s continuing shortcomings in managing the Fund’s interest rate risk.
The first tracks how the fund’s yield (blue line) began trailing its market indicators as of mid-2021.
The next shows that the NCUSIF portfolio has been “underwater,” that is below market in value and return, since December 2021. 
The first consequence of this portfolio strategy is that the fund’s primary revenue source is shortchanging the fund and credit unions. The second is that the majority of the fund’s investments are not readily liquid in the event needed without either borrowing or selling investments at a loss.
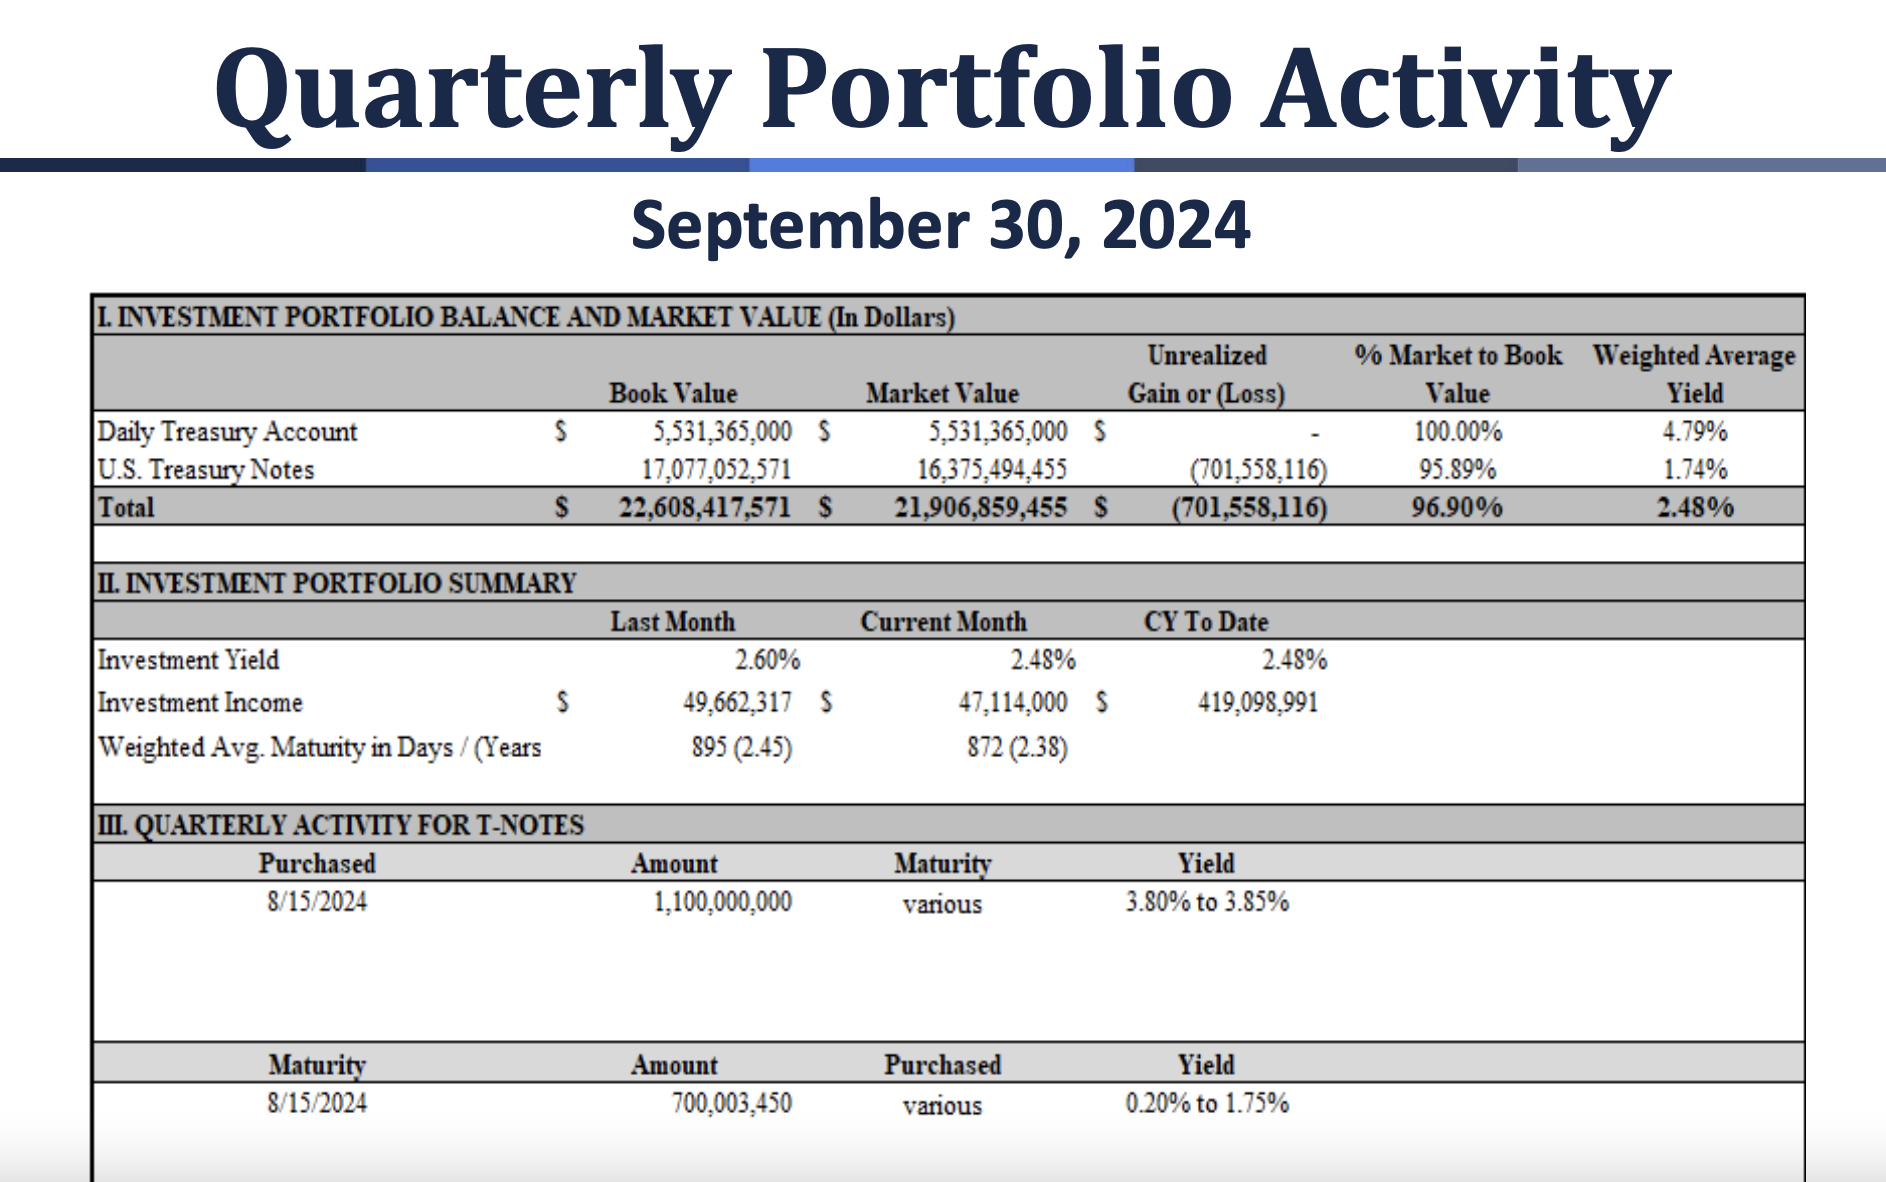
Below is the latest investment report provided to the board in the quarterly review.
It shows an overnight yield of 4.79% on 24% of the portfolio; 1.74% on the remaining 76%; and a weighted average YTD yield of only 2.48%. This below market return is due to the fixed rate bonds purchased following a robotic investment ladder out to over seven years independent of any ongoing IRR assessments.
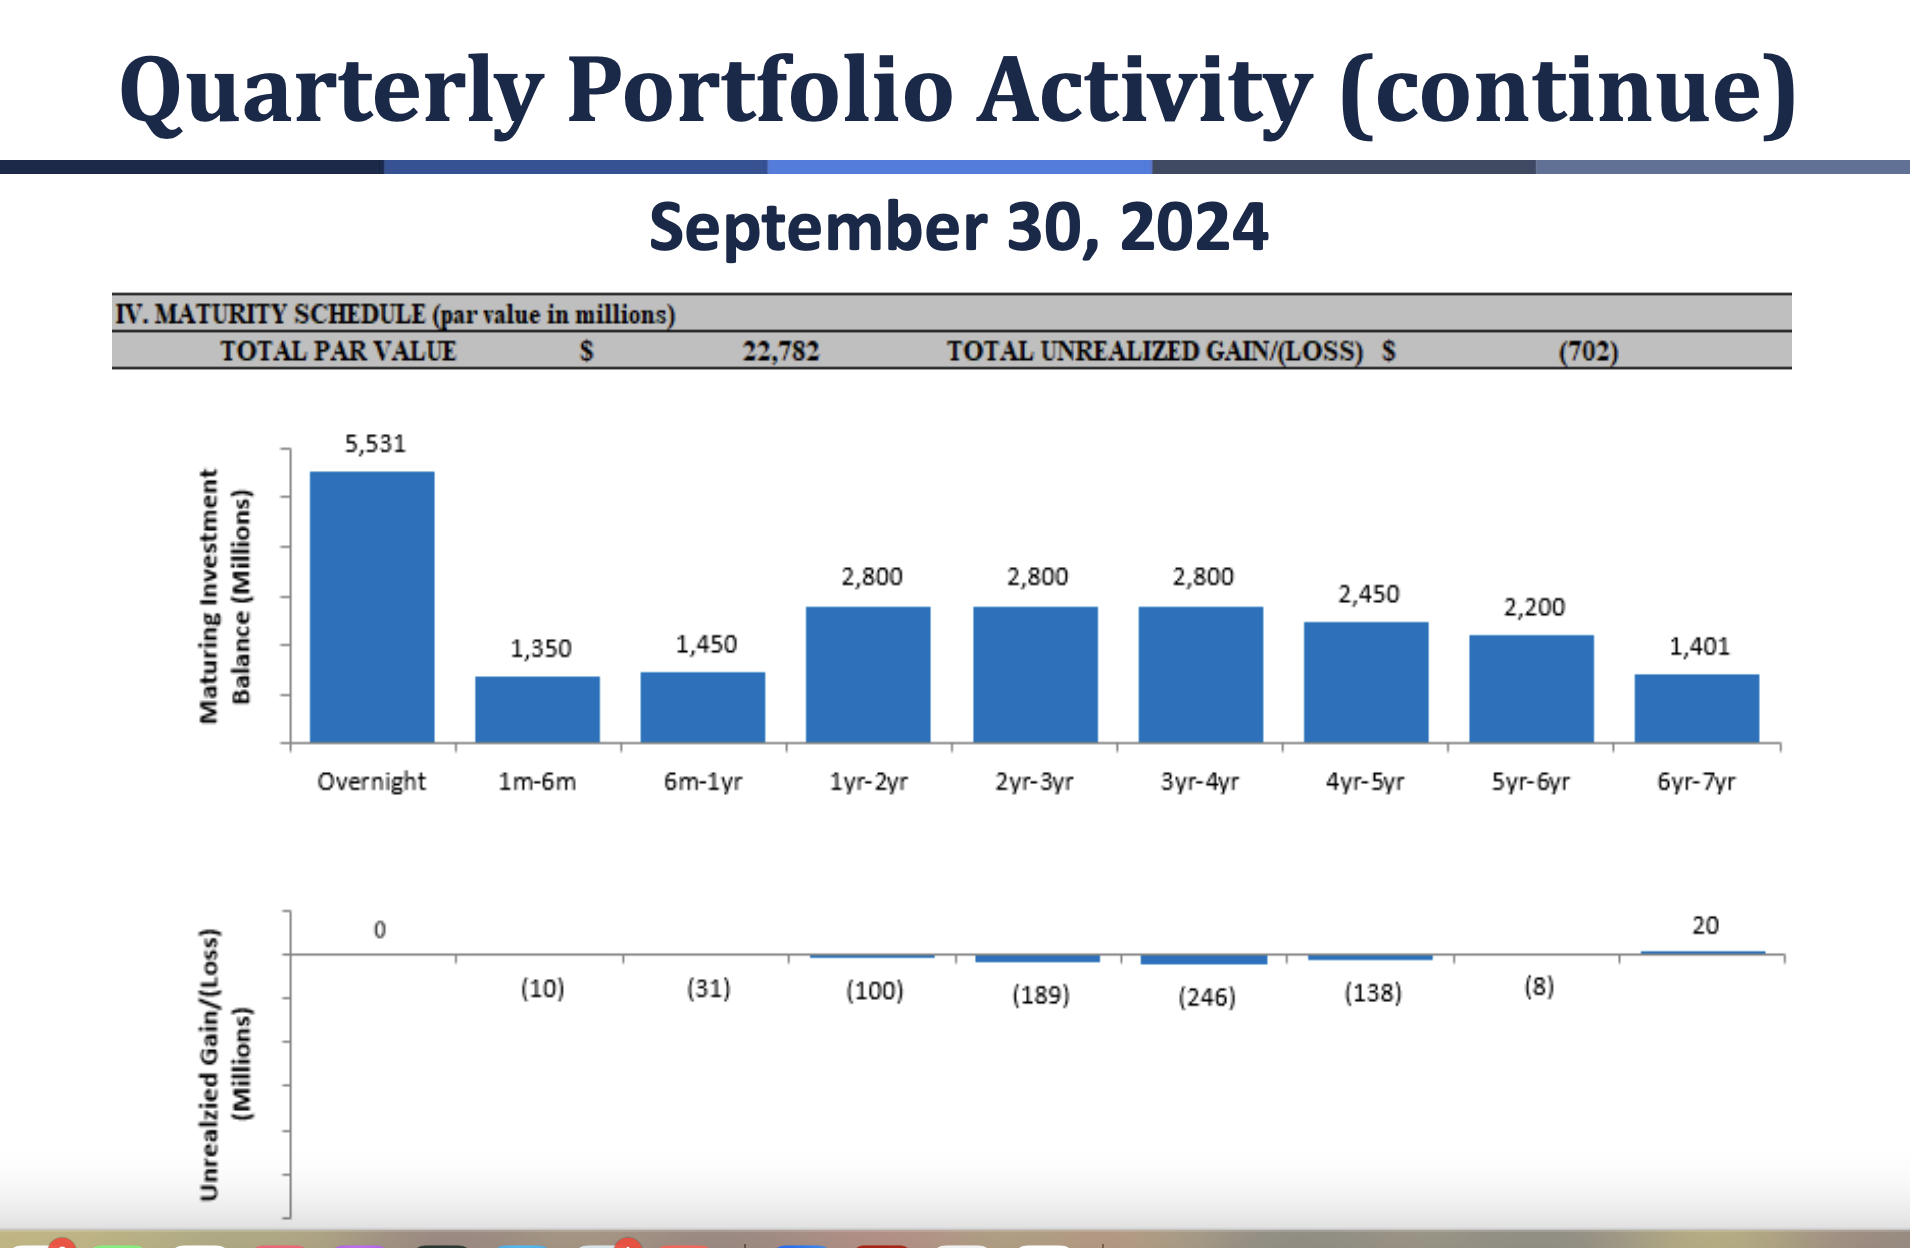
At September 2024, every investment maturity bucket except overnights, and recent investments for seven years, are below market value.
This update shows one investment action during the third quarter: $1.1 billion of bonds purchased on August 15, 2024 at “various” yields of 3.5% to 3.85%. Following are the other yield-investment options that same day from the Department of the Treasury.
| Date | 8/15/2024 |
| 1 Mo | 5.53 |
| 2 Mo | 5.4 |
| 3 Mo | 5.34 |
| 4 Mo | 5.22 |
| 6 Mo | 5.04 |
| 1 Yr | 4.52 |
| 2 Yr | 4.08 |
| 3 Yr | 3.9 |
| 5 Yr | 3.79 |
| 7 Yr | 3.83 |
| 10 Yr | 3.92 |
| 20 Yr | 4.28 |
| 30 Yr | 4.18 |
This August investment decision yields less than all other Treasury options with maturities less than three years-shown in blue. It extends the interest rate risk as measured by the fund’s weighted average life (WAL). It follows the same pattern of activity that resulted in the fund’s past three plus years of underperformance.
With the portfolio’s current WAL, this revenue-yield shortfall could extend for another 2.5 years. Have no lessons been learned from this latest interest rate cycle?
Since 2008, the fund’s data shows that a portfolio return between 2.5% and 3.0% is more than sufficient to maintain an NOL of 1.3%. Returns above that breakeven range would give credit unions a dividend to recognize their open-ended underwriting commitment. More importantly, it rewards their collective risk management.
The Fund does not need more assets relative to risk, as some board members have stated. It needs more effective management of the portfolio investments it already receives.
The Chairman of the investment committee and two of its four members were at November board table responding to questions. This would have been the perfect time for a dialogue about whether alternative investment options were considered. This one day’s investments in August increased IRR risk, reduced liquidity and returned a lower yield than multiple other options.
Instead of explaining this decision, the board continues to put its head in the sand. It glosses over performance charts that would not get past questioning by the newest examiner should a credit union report this outcome and unexamined policy.
In the meantime, credit unions are on the hook for NCUA’s mismanagement of the fund’s return, not just the industry’s potential insurance risks.
The Lack of Transparency
There are a several calculations used in the final numbers that are vital to understanding their reliability. At times in the past these assumptions and data are shown in detail at briefings. This time only a final number is given so that it is impossible to validate the results presented.
The classic example of a lack of transparency was that until February of 2024, the staff had provided its calculation of the modeling data used for recommending the normal operating level (NOL) for the fund’s coming year. This cap determines when a dividend must be paid from net income. In February however, the board continued the 1.33% with no underlying data or assumptions presented to justify a cap higher than the long time, traditional 1.30%.
That 1.30 was exactly the actual NOL reported for December 2023. The financial model was working exactly as designed, yet the staff and board just rolled over the old higher level with no factual justification. The fund’s own performance belied the need for an NOL above the historic cap.
In the prior two years of staff’s 1.33% NOL recommendation, the underlying data were provided. But when modeled out this information did not support their recommendation. Rather it showed that the historic 1.3% cap would have covered all the forecasted model’s contingencies in the next five years. Is that why no details were given for 2024’s NOL setting?
One board member commented in the Q&A for 2024’s NOL that he did not know what the right number should be. Moreover he didn’t think it would make a difference for credit unions whether the cap was 1.3% of 1.33%. As of September 30, the fund’s equity ratio was .303% and headed higher by year end. Should the December 2024 exceed 1.3% that decision will matter greatly, causing credit unions to forego tens of millions in NCUSIF dividends.
The question is not, what is the right cap on the NOL; rather, it is what is the appropriate range for the fund’s equity so that credit unions can share in the success when all goes well. That judgment is no different from managing a credit union’s capital ratio, a decision and responsibility familiar to every credit union board member and CEO.
Other Missing Details
Another disclosure shortcoming was the investment report. Instead of listing the individual investment purchases as in past reports, “various” maturities and a range of yields (3.8 to 3.85%) were given. This suggests the individual securities were for at least 7 years. This investment choice was at a time when the yield curve offered multiple higher returns on all options with maturities less than three years.
These shorter investments would reduce liquidity risk, improve yield immediately and enhance portfolio flexibility—but no board member questioned these August 15 investment decisions.
Undocumented Projections
The 2024 year end NOL projection by staff was given in a footnote as 1.28% in the last slide. In previous December year end forecasts, the staff has presented a full NOL calculation in a single slide. The data included projected retained earnings, insured share totals and the resulting NOL outcome.
Insured shares grew only .46% in the third quarter. If that growth pattern continues in Q4, then the NOL could be much higher than the 1.303 at September. Why present such an important forecast result (1.28%), which is below the current actual level with no substantiating numbers or assumptions?
Yet no board member commented on this lack of disclosure—and its implications for credit unions.
An Increase in Allowance Account and No Losses
Another critical number is the loss expense which is used to increase, or sometimes lower, the total dollars in the reserve account. For the quarter the additional expanse was $21.7 million raising the total allowance to $232 million or 1.32 basis points of September 2024 insured shares. So far in 2024 the total actual insured losses are near zero.
Th allowance ratio is greater than the NCUSIF’s average annual loss experience since 2008. In the most recent five years there have been no major losses. Yet the reserve continues to grow in both dollars and relative to insured risk.
The formula being used for this reserving should be disclosed. This expense comes right out of retained earnings and thus reduces the NOL number. Just as when presenting an NOL forecast, the underlying assumptions and data should be open for board, public, and credit union scrutiny.
The State of the Board’s Stewardship
As for Otsuka’s call out of the board’s stewardship of the NCUSIF, the examples above are some of the specific opportunities to enhance this responsibility. And we haven’t even gotten to the backward looking calculation of the NOL, but that issue is for another day.
Endnote: Brief History of NCUSIF Redesign
The new NCUSIF financial design in 1984 was based on a study of insurance alternatives and the fund’s initial 15 year trends. The traditional premium approach in the first years of the 1980’s required double premiums assessed by NCUA. But even then, the fund made no headway toward the statutory goal of 1% of insured shares.
There were two major reports of this in-depth reassessment. One was a 100 page study sent to Congress on April 15, 1983 by Chairman Callahan. The report addressed specific congressional questions, provided a history of cooperative stabilization and share insurance funds, and gave recommendations for change. It also included extensive comments from credit union leaders.
When the new design, A Better Way, was established by Congress in 1984 the background analysis for a new model was explained in the video below. It was sent to all credit unions outlining this unique collaborative effort and its benefits for credit unions. For without the credit union support, there would have been no congressional action to authorize this unique cooperative approach to NCUA’s share insurance model.


