I missed the November 21 NCUA board’s NCUSIF update so went back and listened to the 30 minute discussion via video. The report was incredibly positive. About both the financial performance of the fund and credit union industry trends.
There were several data “blanks” and areas that were not covered that I will discuss tomorrow.
The slides used to update the NCUSIF can be found here. YTD net is over $226 million which raised the Fund’s total retained earnings to $5.4 billion. This is .3033% of total insured shares ($1.767 trillion) at September 30, thus exceeding the .30% historical NOL cap.
Total insured losses for the year are negative, that is, recoveries of $2.0 million on prior losses have offset current writedowns of just $1.1 million. Nonetheless, NCUA has increased the loss allowance reserve to $232 million, or 1.3 basis points of insured shares in addition to the .3033 in retained earnings.
Since 2014 the NCUSIF has recorded actual net cash losses that exceeded 1 basis point of insured shares in only one year, 2018. That year the Fund wrote down the value of its portfolio of taxi medallion loans. In 2020 it sold this portfolio to a New York distressed asset fund manager (Marblegate) which benefitted from the full recovery in portfolio value as credit unions took all the write downs via the NCUSIF.
The CAMEL Trends
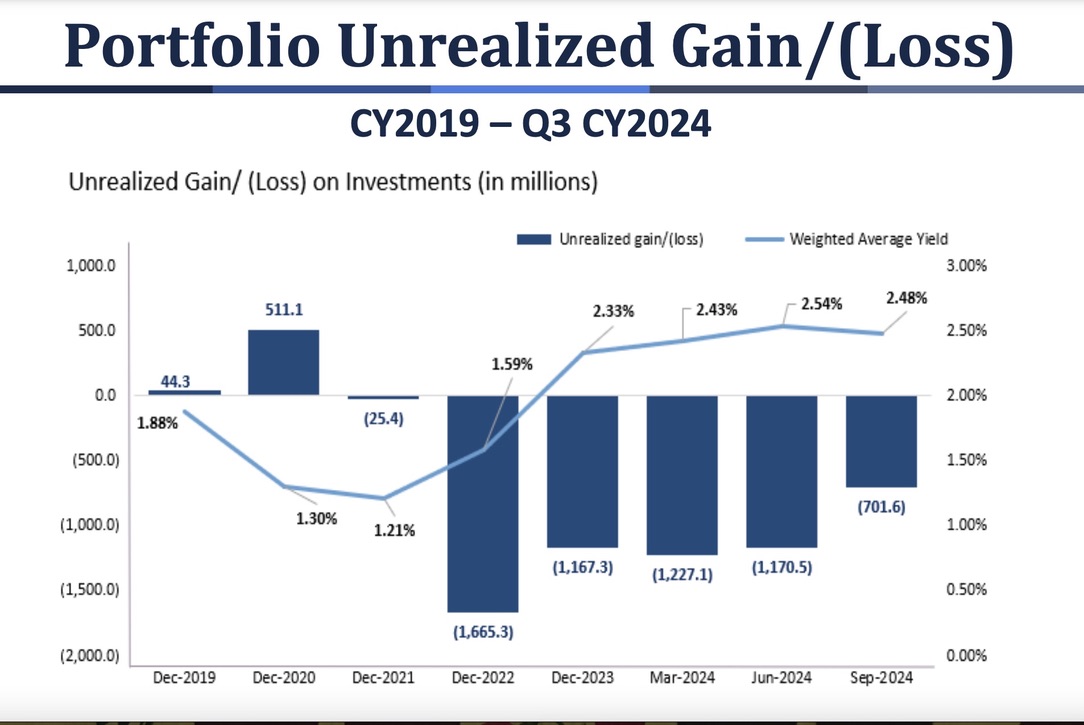
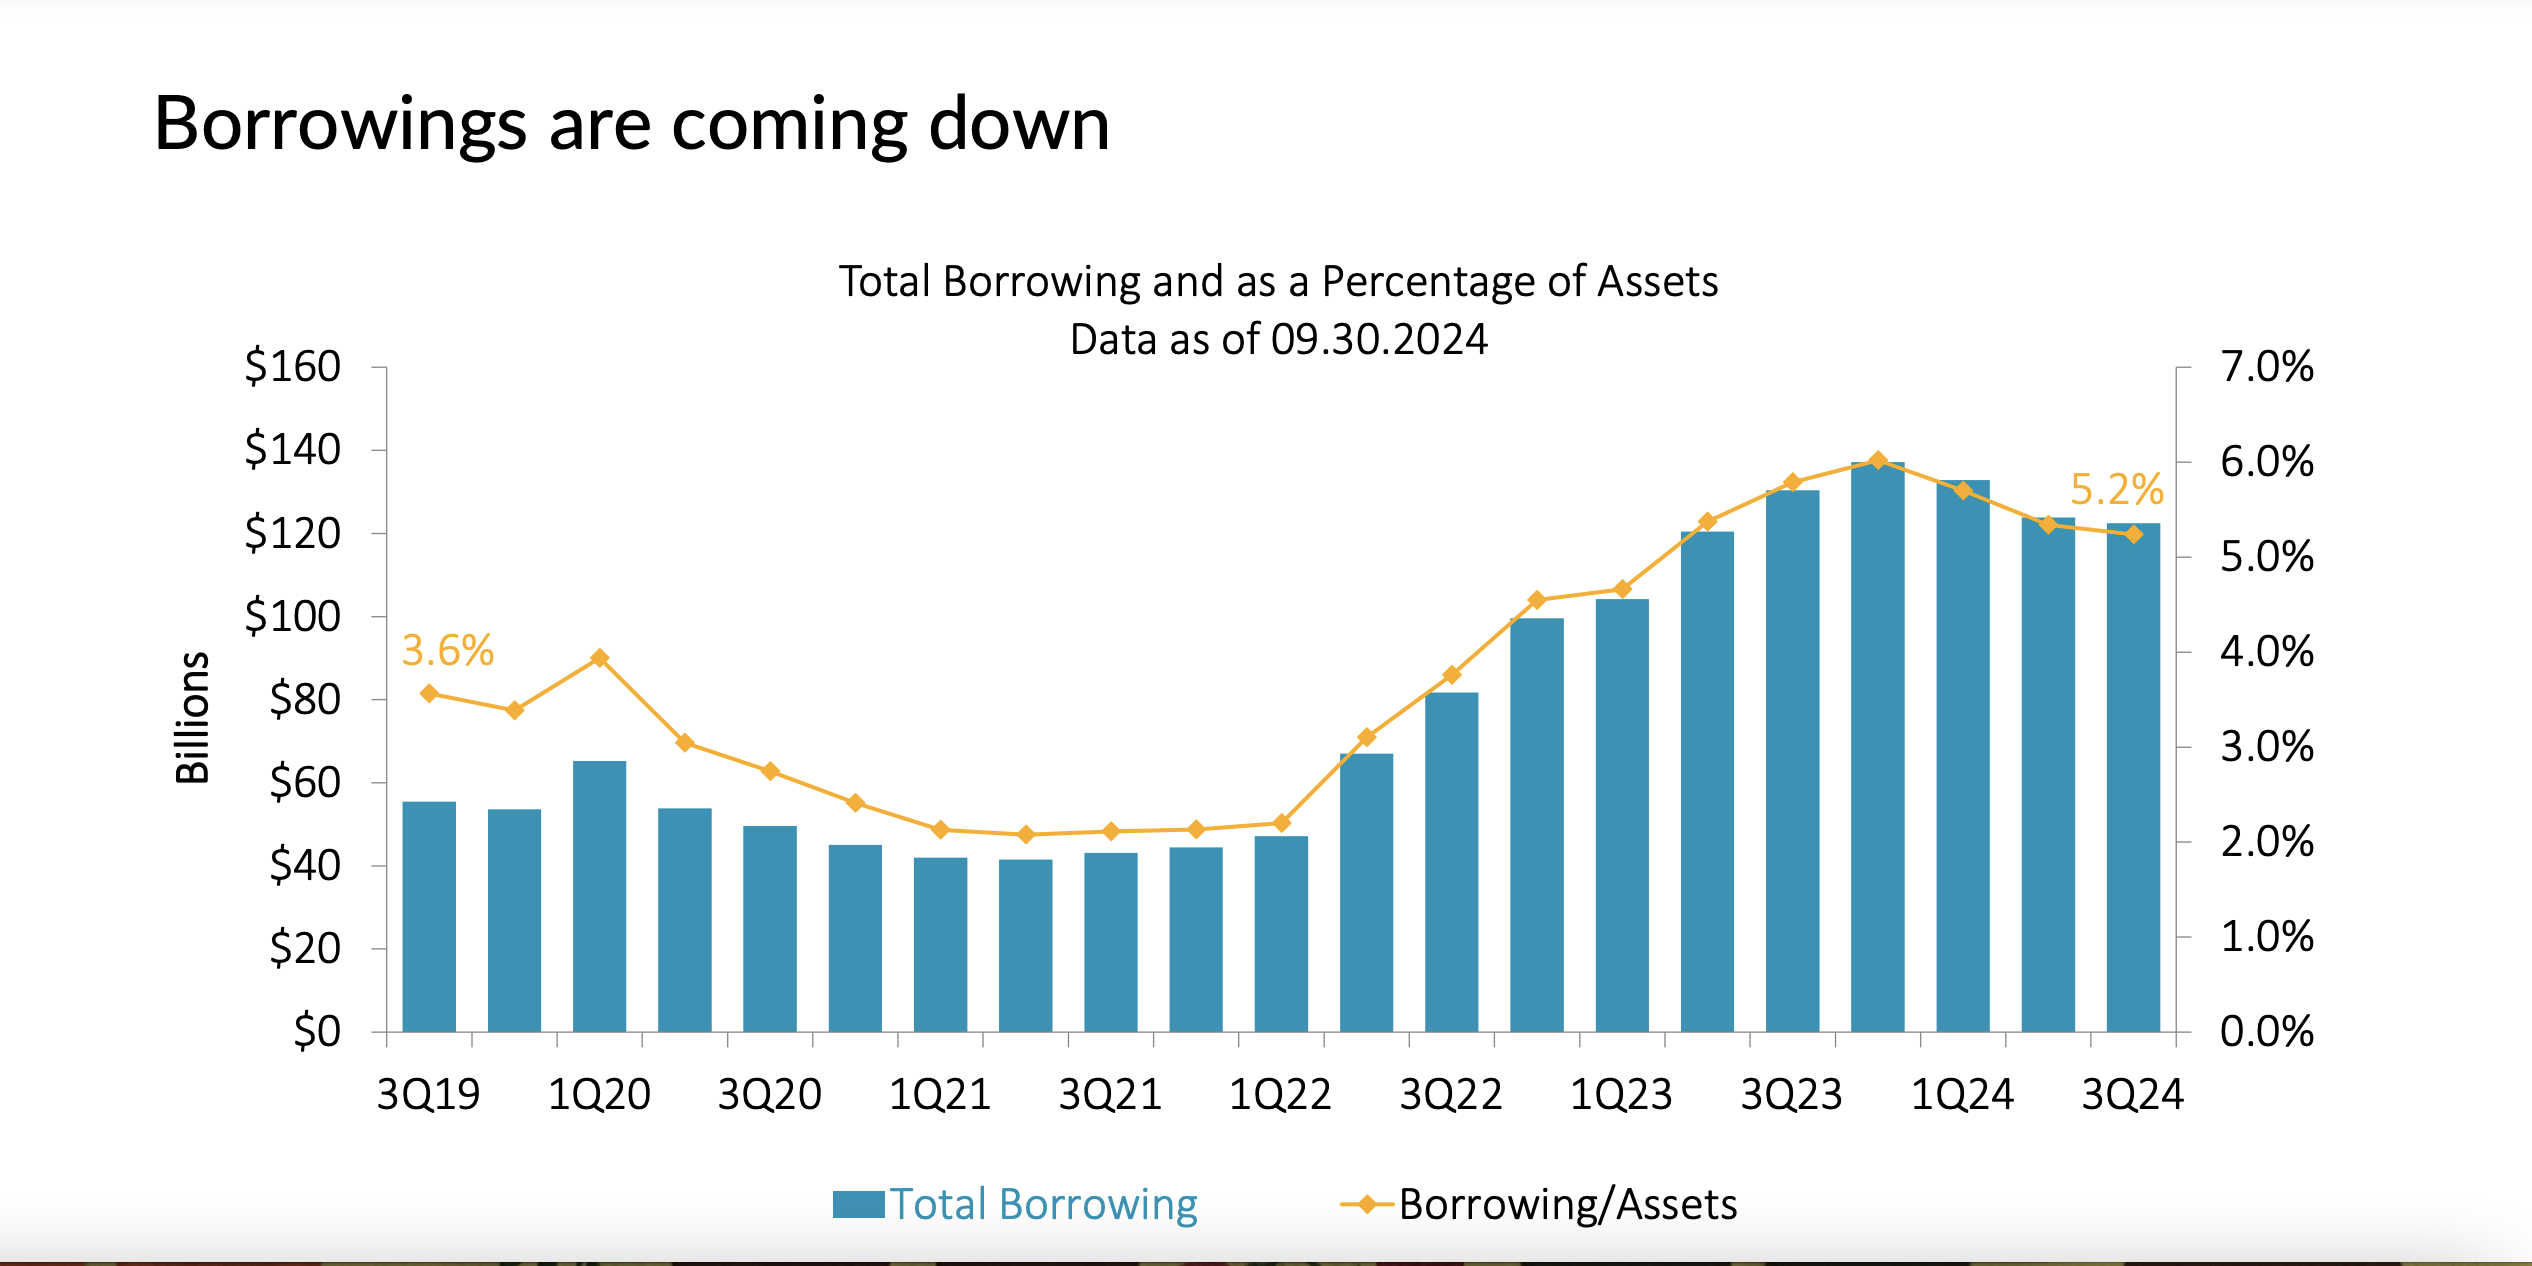
Even the CAMEL trends are positive. Kelly Lay Director of Examination and Supervision was at the table. The % of credit union assets classified as Code 4 & 5 declined from the June quarter. When asked about the change, Lay said it was because of improvements in specific credit union’s liquidity positions-a trend validated in Callahan’s third quarter TrendWatch analysis presented on November 12, 2024, nine days prior to the board meeting.
These two slides from that presentation show these changes in system liquidity:
She further stated that any large credit union that is downgraded in rating or with a 4/5 CAMEL ratings is examined at least annually. When pressed by a board member about potential exposure in commercial real estate loans, she replied that “there was nothing very concerning.”
External Third Quarter Data Analysis Positive
Several times board members referred to second quarter data, one citing an increase in delinquency and lower ROA at June 2024.
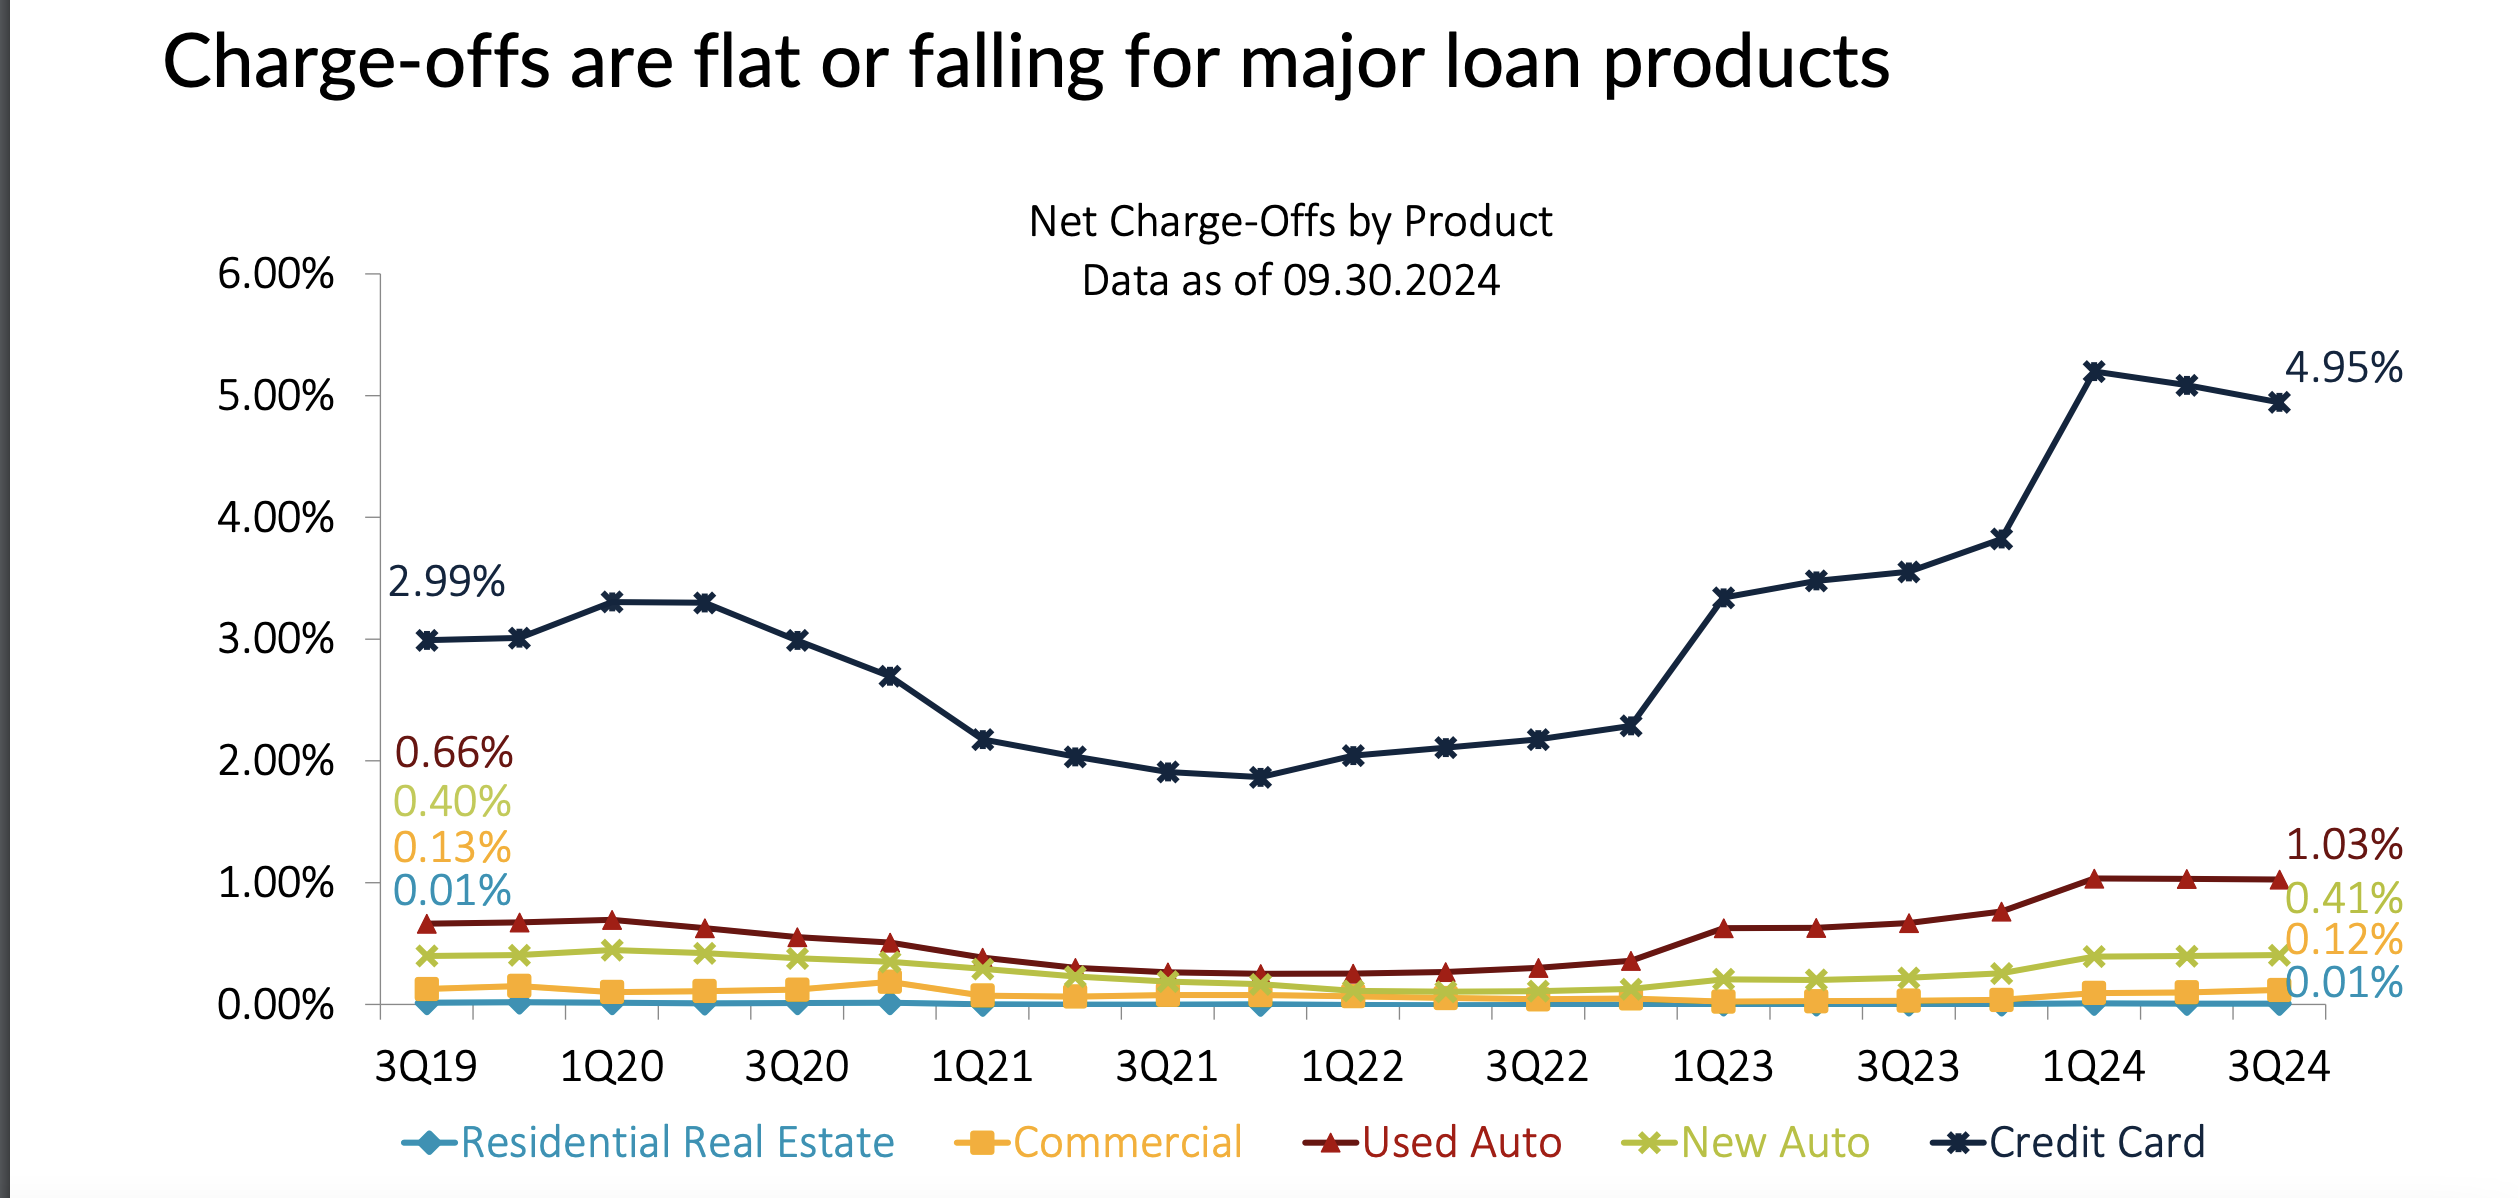
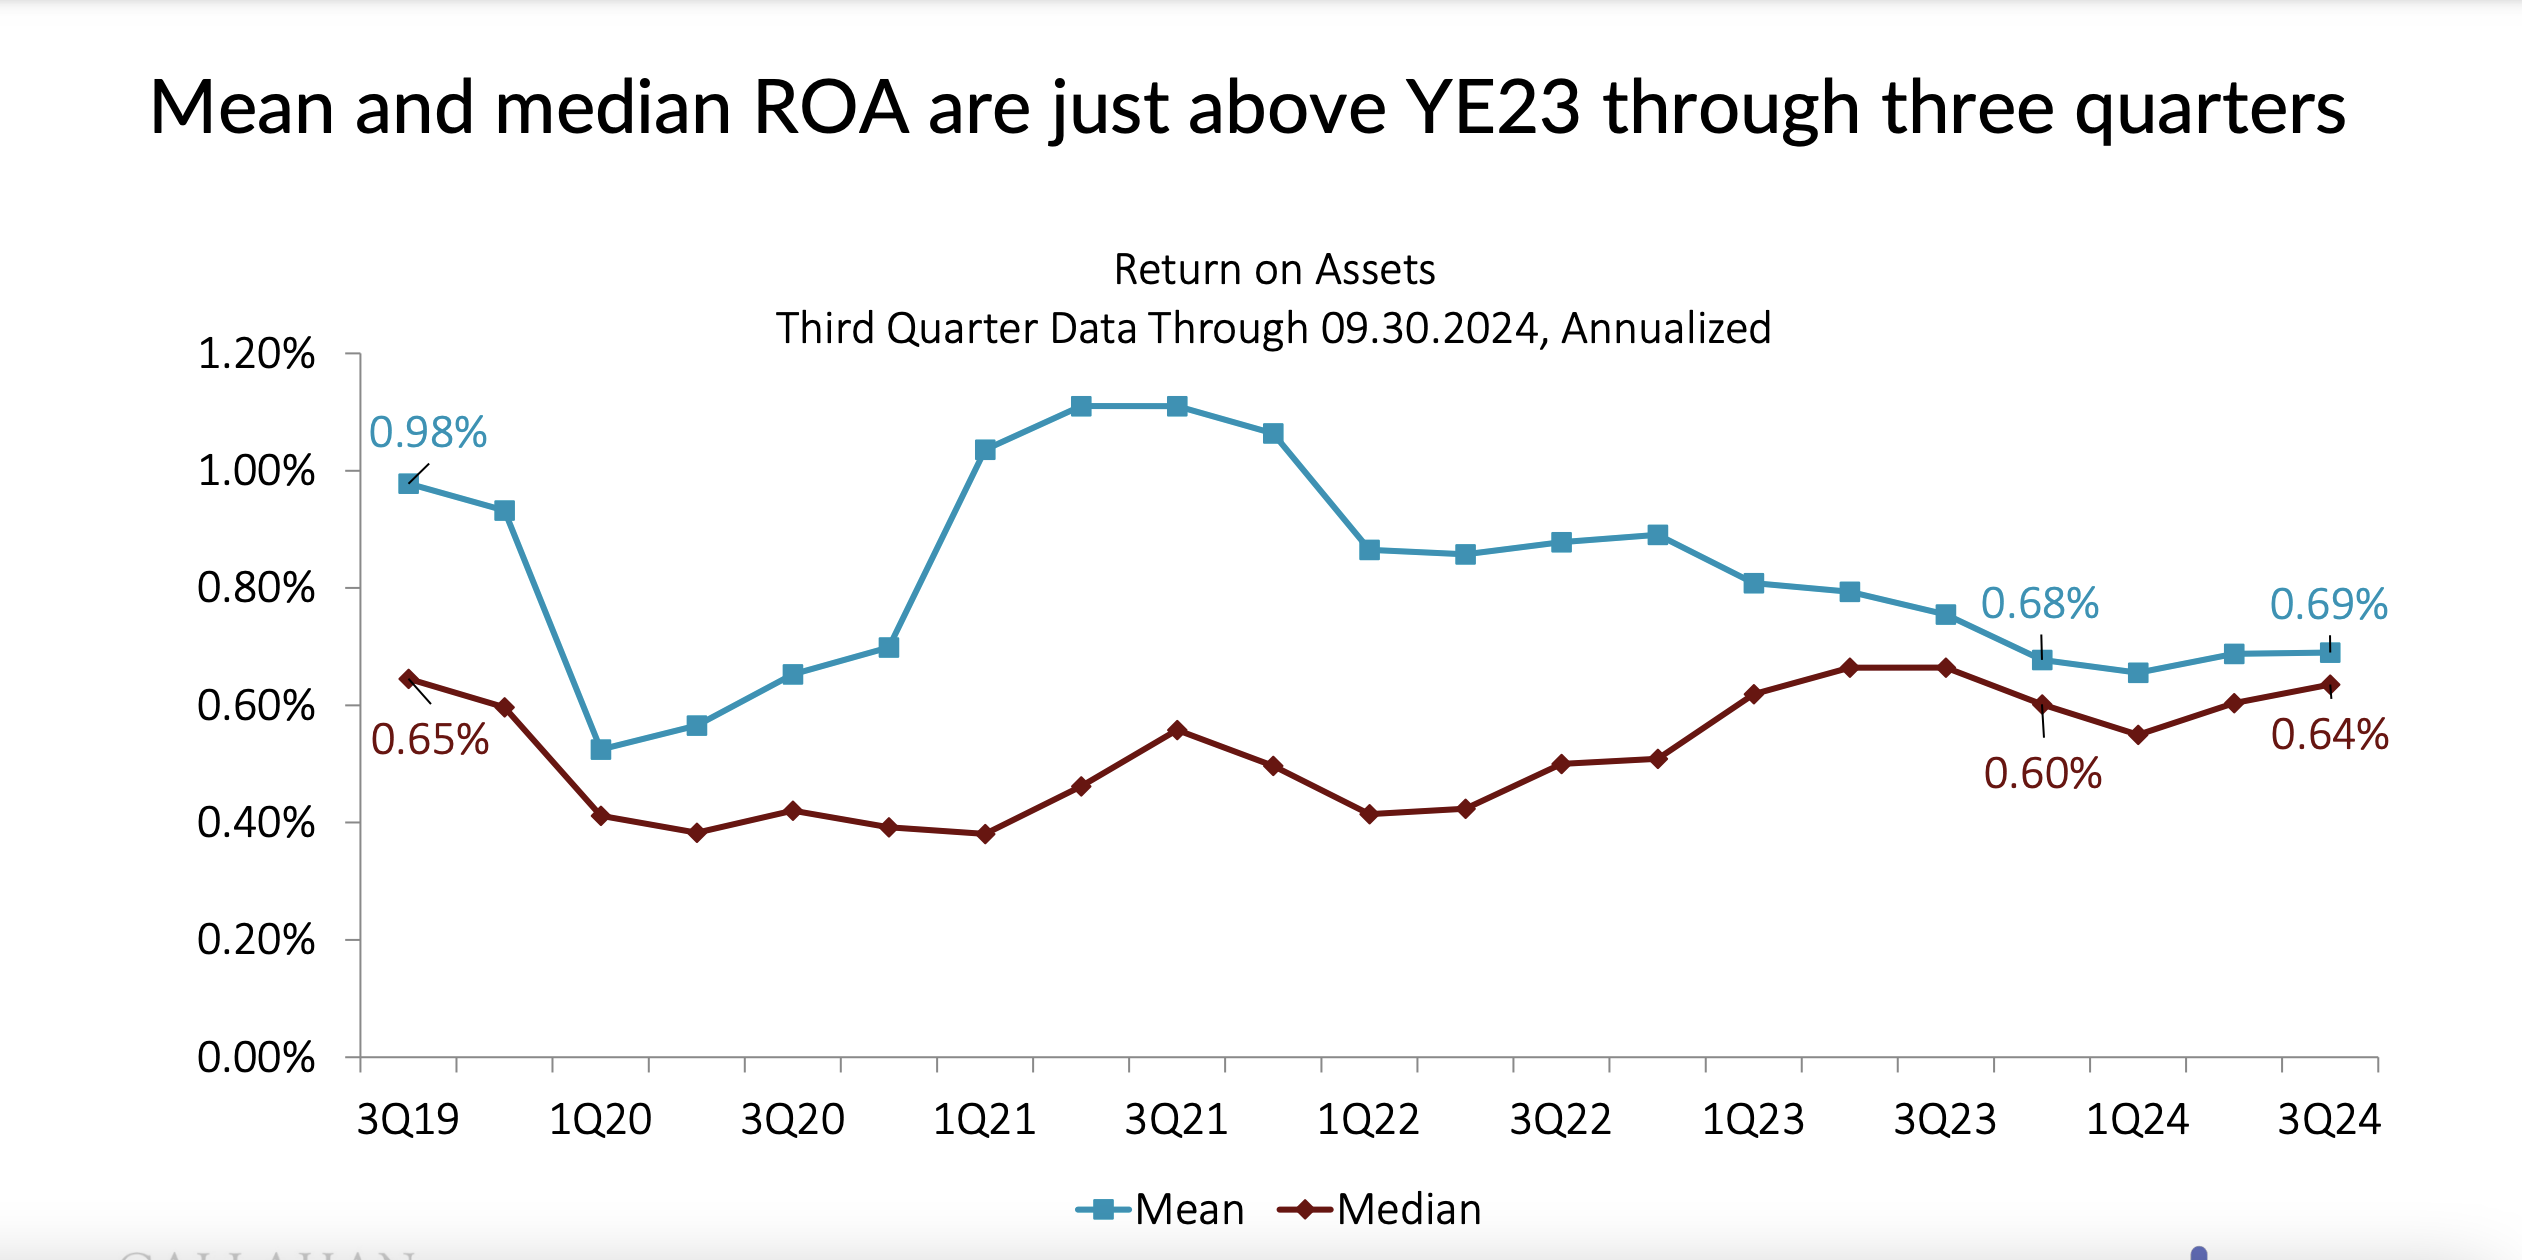
However both the macro-analysis in Callahan’s 3Q Trend Watch Video and the large, individual credit union performance comparisons by Jim DuPlessis of Credit Union Times all show marked improvement in the third quarter.
Two excellent data analysis by Jim DuPlessis include graphs that do not support this observation from older data:
Analysis of five most recent quarters through Q3 ’24 of industry loan production, published on November 4.
Top Ten Credit Union’s Earnings Still Improving on November 1, using the most recent five quarters through Q 3, 2024.
Two of TrendWatch slides:
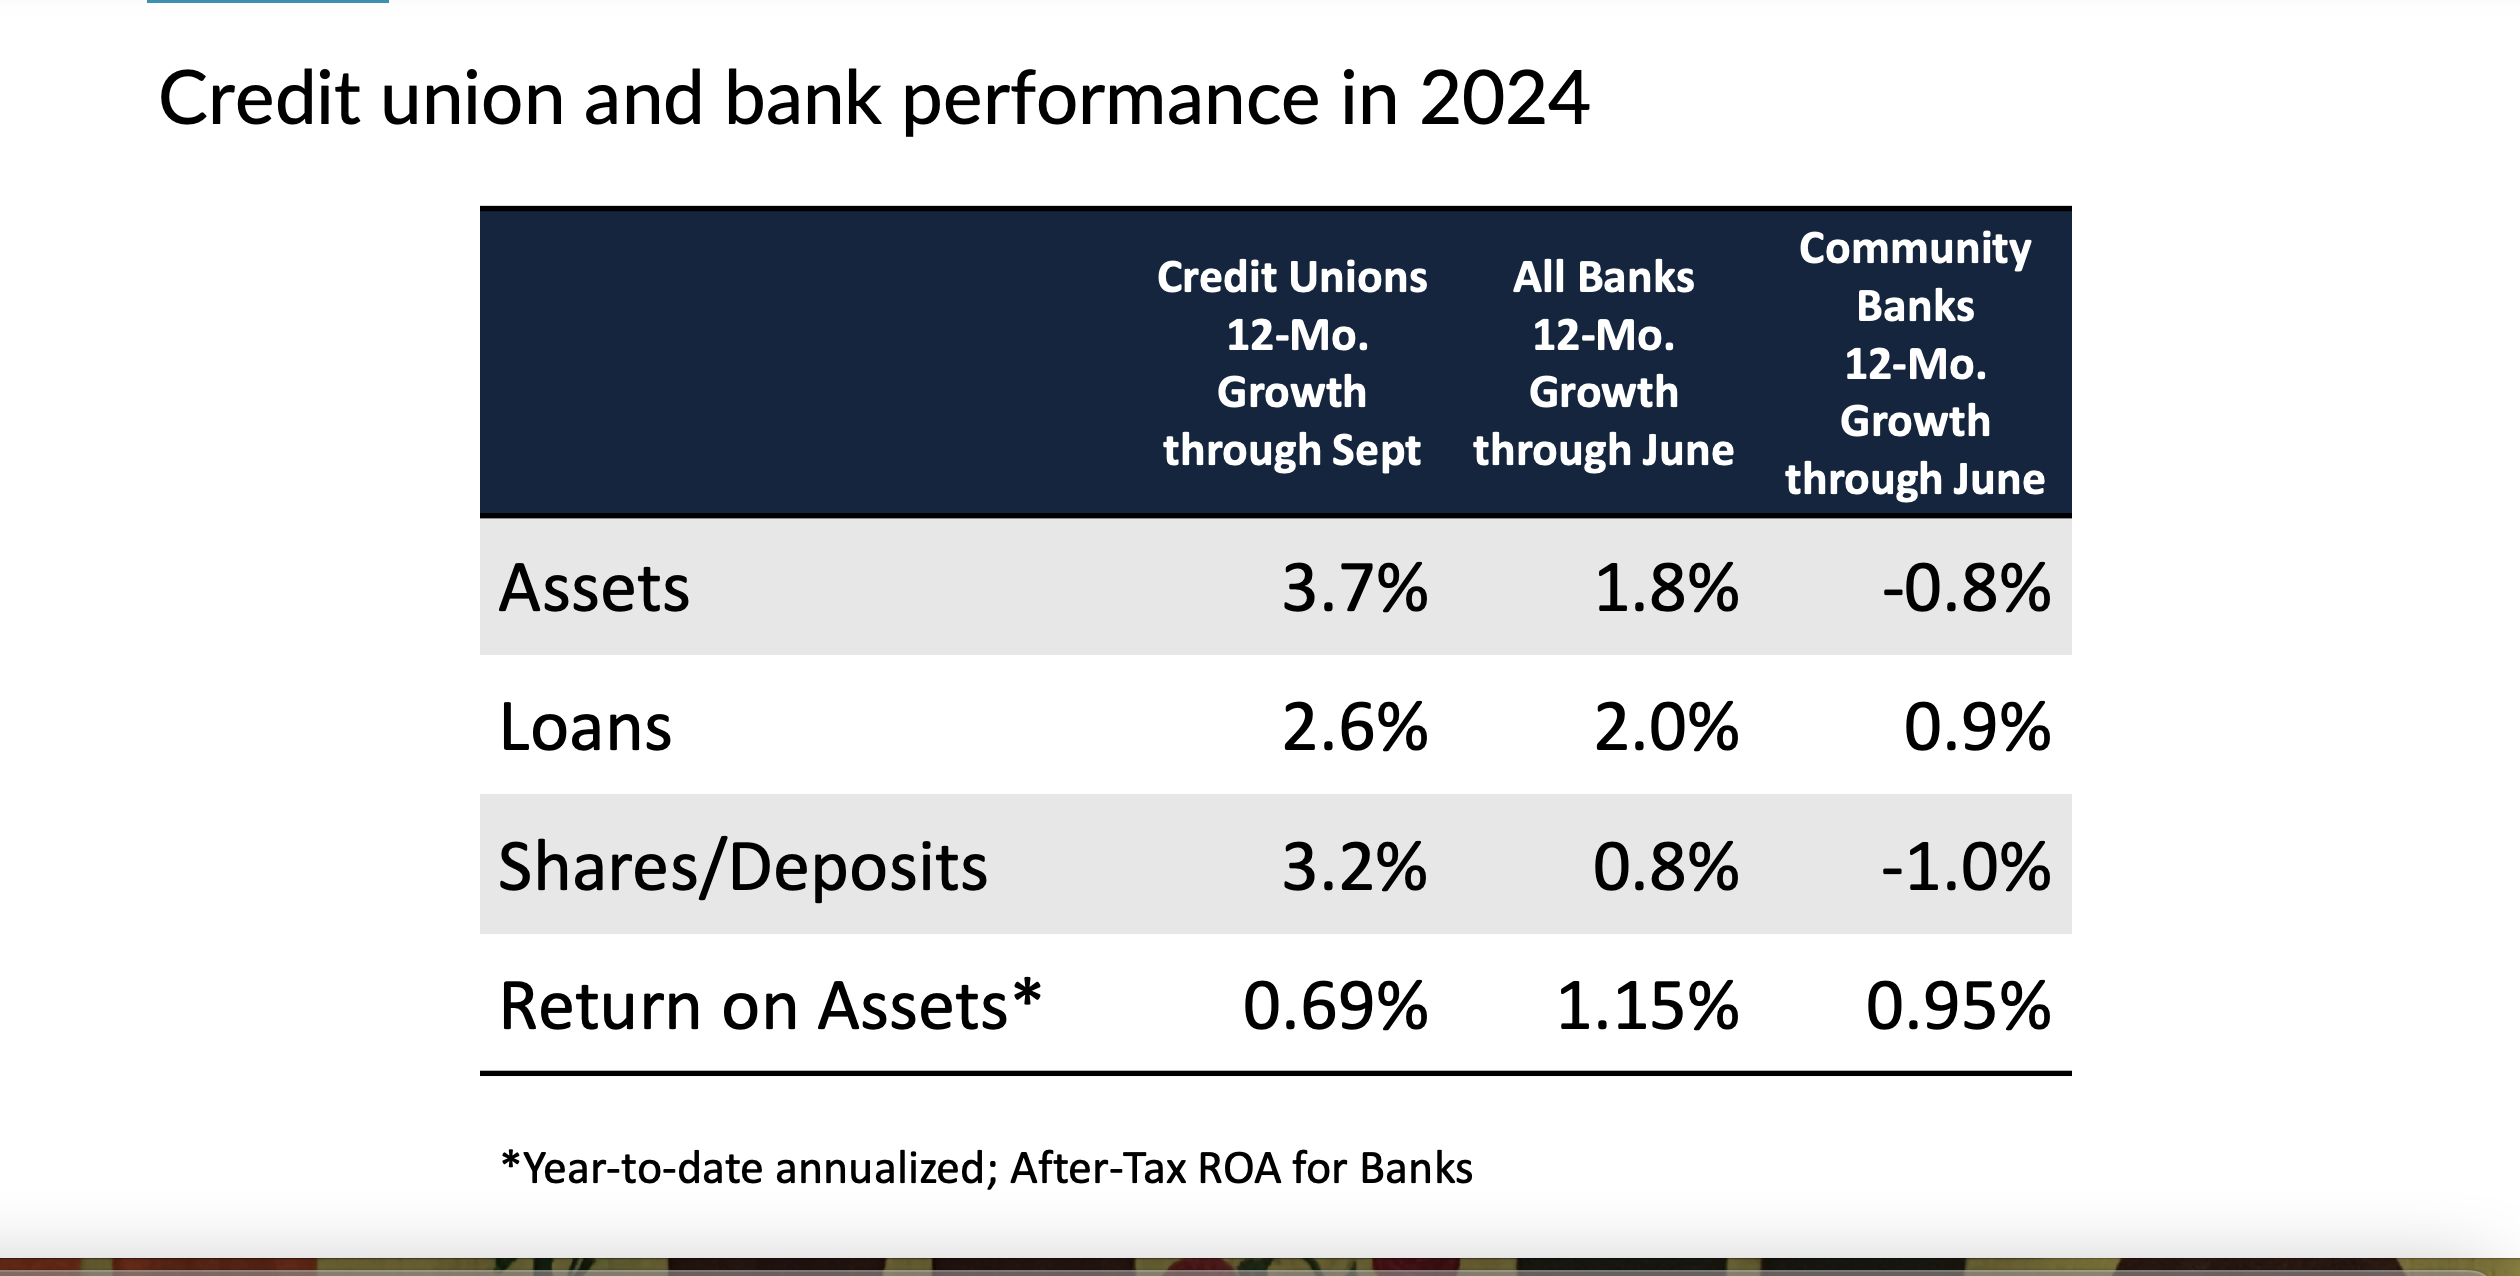
And if the macro trends in credit unions was not convincing by itself, the final TrendWatch slide showed this perfpr,amce comparison with competitors thru June as later data is not yet released:
Stewards of the NCUSIF
In her opening statement board member Otsuka commented: Being stewards of the National Credit Union Share Insurance Fund is one of NCUA’s primary jobs—a critical component of our duty to protect members’ shares at credit unions. Thus, I continue to be encouraged by the strong performance of the Share Insurance Fund.
Tomorrow I will cover areas where the data was lacking compared to prior updates and the one primary performance topic that the board failed to address.
In future updates, the presentations could be improved if more timely data were used, so the board members have the benefit of the latest information when asking questions or making comments. Or even when testifying before Congressional committees.

And yet we have the recent congressional testimony of the Chairman wanting more control over NOL and capital ratios in order to make it easier to grab our members capital.
Time to be looking for credit union alternatives to NCUSIF.