The centerpiece of today’s NCUA’s board agenda is a review of the NCUSIF’s 2023 performance. Three areas are most important:
- Loss management and the reserving allowance estimate.
- Investment performance oversight.
- Trends in operating expenses.
The 2023 insured share growth was published in the audit preamble, so the NOL cap for yearend 2024 is the outstanding board determination.
This annual NOL review was a commitment by Chairman McWatters when the two-person board first raised the historic 1.3% cap in the NCUSIF in 2017. This change was to retain the inflow of funds from the merger of the TCCUSF. Credit unions uniformly questioned this process and urged a return to the 1.3% as soon as possible. It has been seven years.
The Insured Losses Rate and Allowance Level
The 2023 net cash losses in the NCUSIF were minuscule, just $1.0 million. In comparison the banking system has paid the FDIC $761 billion in premiums for “receivership costs” through September 2023.
CFO Schied stated in his board update last fall: Since the last taxi failure on October 2018, actual SIF losses are a total of $53.8 million or .0031% (.31 bps) of insured shares as of June 30, 2023.
With the full 2023 results now in, this annual loss rate is less than .10 basis point per year. A remarkable record during five years of economic ups and downs.
The NCUSIF’s yearend $209 allowance account is 1.2 basis points of insured savings or 12 times this annual loss rate. Or five times the total for all dollar losses in the past five years.
CFO Schied told the board that this reserve amount is determined using a macroeconomic model. Will the numbers, assumptions and calculations in this model be available so users of the statements know how it works and its factual validity?
NCUSIF’s Investment Portfolio Management
The $22.4 billion (book value) in total NCUSIF investments is the only revenue source for the fund, unless the Board chooses to assess a premium. This has occurred only four times in the past forty years.
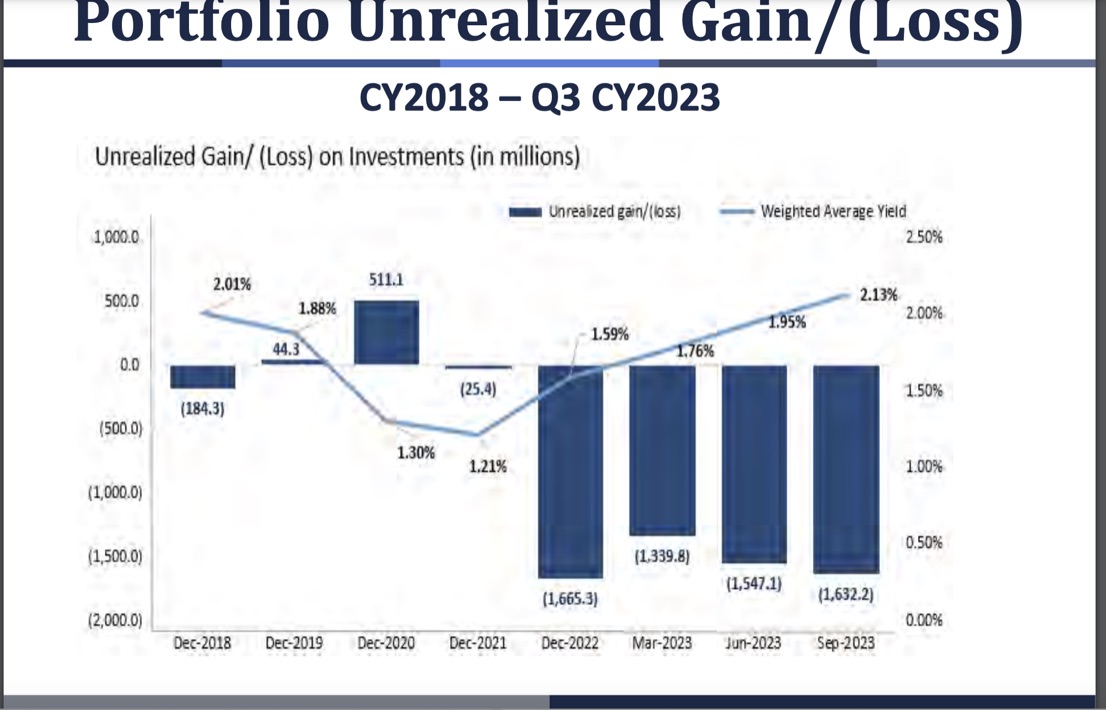
Since December 2021 the portfolio’s market value has been less than book.
This means the portfolio is not earning current market rates. At yearend 2023 the NCUSIF’s term portfolio had a yield of just 1.4%; the $5.2 billion in overnight funds earned 5.4%. The combined yield for all 2023 was just over 2.0%.
During 2023 the buildup of portfolio cash reduced the Fund’s weighted average yield by a full year, from 3.33 years to 2.30 years. This change reduces interest rate risk. This number is the approximate time it would take the portfolio’s reinvestments from maturing securities to reprice if rates normalized at their current level.
In last fall’s presentations to the NCUA board, the CFO indicated that the Fund’s investment policy had not changed. And that having achieved the initial cash target ($4.0 billion), the committee would begin considering extending out the curve—even though the interest rate curve continues to be inverted.
Interest rate risk is the primary threat to be managed consistent with optimizing earnings. This is what I believe an NCUA examiner would write about the current Board oversight. The wording is borrowed from a CAMELS code 3 exam of a multibillion dollar credit union:
Risk: Strategic Degree of Risk: High
CAMELS Effect: Management, ALM, Earnings, Capital
Reason for rating: A capital planning discipline is not in place to manage the interest rate risk (IRR) that is commensurate with the size and complexity of (credit union). . . and the exposure presented to the NCUSIF.
The Credit union’s ALM (investment) policy establishes guidelines related to capital, net income, and net economic value of equity, but does not contain specific, established interest rate risk limits.
Examination Requirements: Matters requiring Board attention.
The board should further develop, document, and implement a policy to measure and monitor interest rate risk. The revised policy and plan should include the following actions at a minimum:
- Establish and implement maximum policy limits for the interest rate risk metrices used in the ALM/investment analysis.
- Evaluate and provide interest rate compliance and trending reports/charts based on the existing balance sheet under current rate forecasts monthly.
- Update projected yearend capital ratios on a monthly basis.
I could not have suggested a better approach for the Board’s attention.
Operating Expenses
Since 2008, 93% of the operating expenses of the fund are from NCUA’s overhead allocation of its expenses via the Overhead Transfer rate. The OTR ranged from a low of 52% (2008) to 73.1% (2016). For 2023, NCUSIF’s operating expenses increased 12.6% using an OTR of 62.4%.
From 1979 through 1984, the percent of NCUA’s expenses paid by the NCUSIF, were never higher than 26% (pg 39 NCUSIF 84 Annual Report). Until 2001, the transfer rate had been fixed at 50%.
The current expense level equals approximately 1.3 basis points of insured shares. In terms of yield on the entire portfolio, this requires the fund to earn 1%. Operating expenses are a fixed cost, right off the top of revenue. If not controlled they take resources away from the Fund’s primary insurance resources.
Calculating the Normal Operating Level
With the audit numbers and the total of insured shares from December call reports in hand, the equity to insured shares ratio can be computed at yearend. NCUA says the NOL number is 1.3%.
This ratio determines the prospect for a dividend when the fund’s net income raises retained earnings above the NOL upper cap. This cap is set by board action each December.
The 2022 board meeting kept the 2023 upper limit at 1.33 even though one member expressed the view that it should revert to the historical 1.3% which had existed until from 1984 through 2017.
When will the board make this determination for 2024?
The meeting starts at 10:00 AM. For a full review of credit union’s financial performance, Callahan & Associates presents their quarterly Trend Watch analysis at 2:00.

