One year ago March 2020, a national emergency and economic lockdown was declared to deal with the Covid 19 pandemic.
What followed was the sharpest one quarter GDP contraction and highest jump in unemployment in history. No one knew how long or how serious the total disruption of all areas of human activity would be.
Today the recovery trends in the economy and society at large are well underway. Credit unions are both examples of this incredible turnaround as well as enablers who assisted members through this period of uncertainty.
Last week’s Trend Watch analysis of March 31, 2021 data by Callahan and Associates, was positive on every front for the cooperative system. Buoyed by a first quarter GDP gain of 6.4%, major balance sheet growth results were in the high teens.
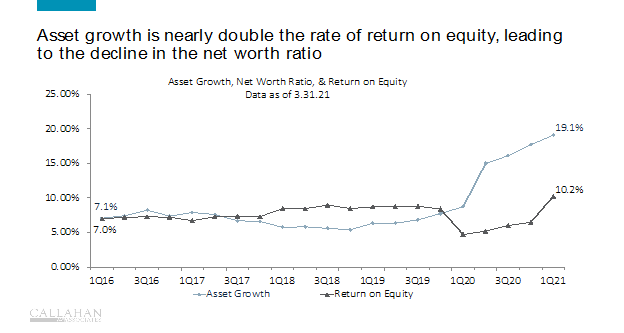
The 19.1% annual asset growth was the fastest in memory, propelled by a 23.1% share increase. This share deluge led to a 57%, 12-month leap in the investment portfolio. All 64 slides in Trend Watch can be viewed here.
What About Capital Ratios?
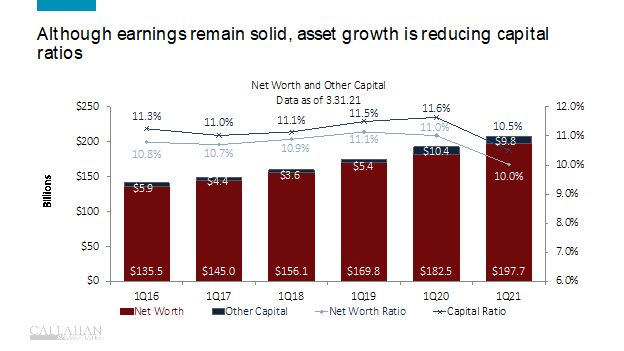
The following slide shows the most recent five years relation between capital growth, ROE, and assets.
The divergence between these two growth trends from their long-term historical relationship resulted in a small year over year decline in the net worth and capital ratios. Overall the industry remains very well reserved with a 10% net worth ratio and over $200 billion in total capital.
The Cooperative Capital Formula: Revenue Flows and Retained Earnings Grow
This small change should not concern for two reasons listed below. For the first 90 years the cooperative measure of reserve adequacy was based on a “flow” concept for capital creation. That is credit unions were required to set aside 10% of revenue until the capital/risk assets ratio reached 4%. Then this formula was reduced to 5% of revenue until a 6% ratio was reached.
When PCA was implemented by the 1998 Credit Union Access Membership Act, this measure of capital adequacy was changed from a “flow” measure to a “stock” concept imposed by Prompt Corrective Action ratio benchmarks. A 7% net worth ratio is now rated well capitalized. Revenue was taken out of the capital assessment.
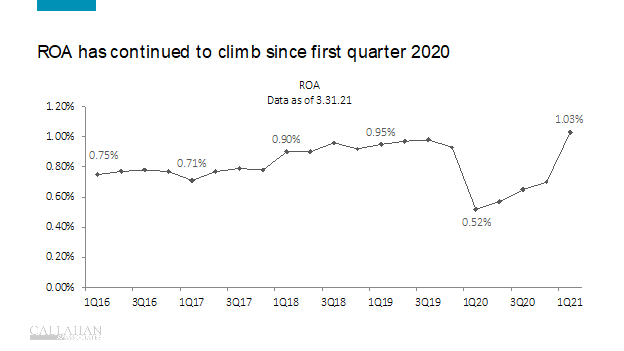
The first reason: as shown below the “flow” into retained earnings measured by ROA exceeded 1.03% for the quarter. This is the first time since December 2012 this rate of net income has been reached. Credit unions have no access to outside capital. Retained earnings, their source of capital, is once again trending upward.
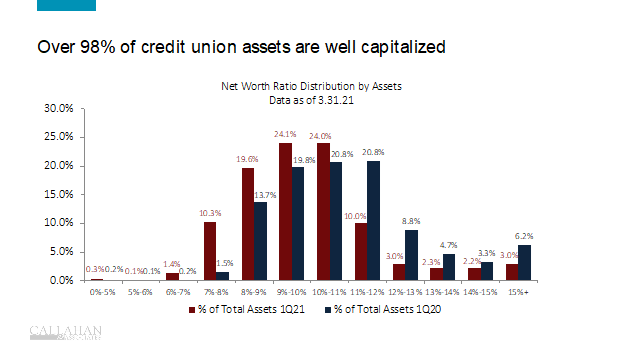
The second reason: credit unions managing 98% of the systems assets meet or exceed the 7% well capitalized PCA benchmark.
Many slides in the Trend Watch deck demonstrate sound trends with delinquency lower, tons of liquidity, and refinancing volumes and lower fees helping members save money. An outstanding first quarter for what appears to be a breakout year for the economy.
Credit union performance with their focus on members’ well being are an untold story of this recovery. Hopefully this extraordinary collective outcome will be recognized by all as affirmation of cooperative design and purpose.


